Happy 500th Birthday Yield Curve Inversion!
News
|
Posted 23/04/2024
|
812
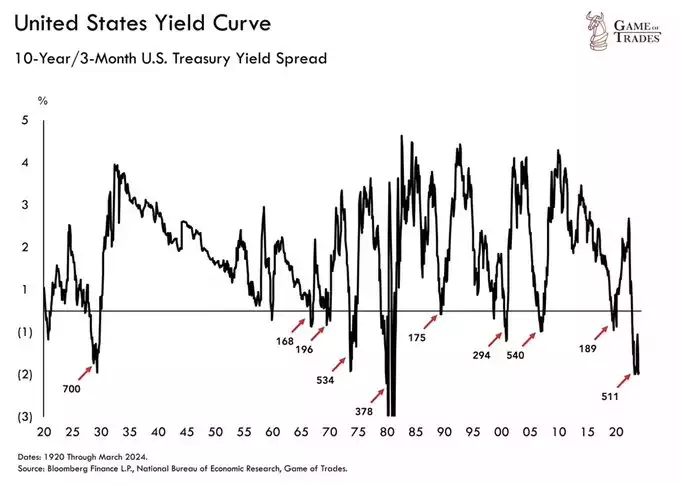
Remember in the lead up to the U.S. Treasury market yield curve inversion when everyone was so nervous? That was now over 500 days ago as quietly last week we crossed a Rubicon only seen 3 times in history – 1929, 1974, and 2008. i.e. the great depression, the depth of the 70’s stagflation crisis and the GFC. Where to from here?
As a reminder, a yield curve inversion sees a reversal of a ‘healthy’ yield curve that slopes up and to the right in that longer term treasuries offer a higher yield than short term notes to factor in the risk premia for holding debt for longer and its ability to outpace inflation etc. This healthy set up allows banks to sell you debt (mortgages etc) at a higher rate (based on long-term rates) and fund it with short term bonds, taking the difference as profit.
When the yield curve inverts, historically a recession always follows. It has a near perfect track record for over 100 years. As you can see in the chart below, each inversion has been followed by a strong steepening in the eye of a recession. i.e. yields at the short end plummet as monetary conditions are eased to rescue the economy. The long-term increase reflecting the inevitable inflationary effects of that stimulus and risk presented to the bond market.
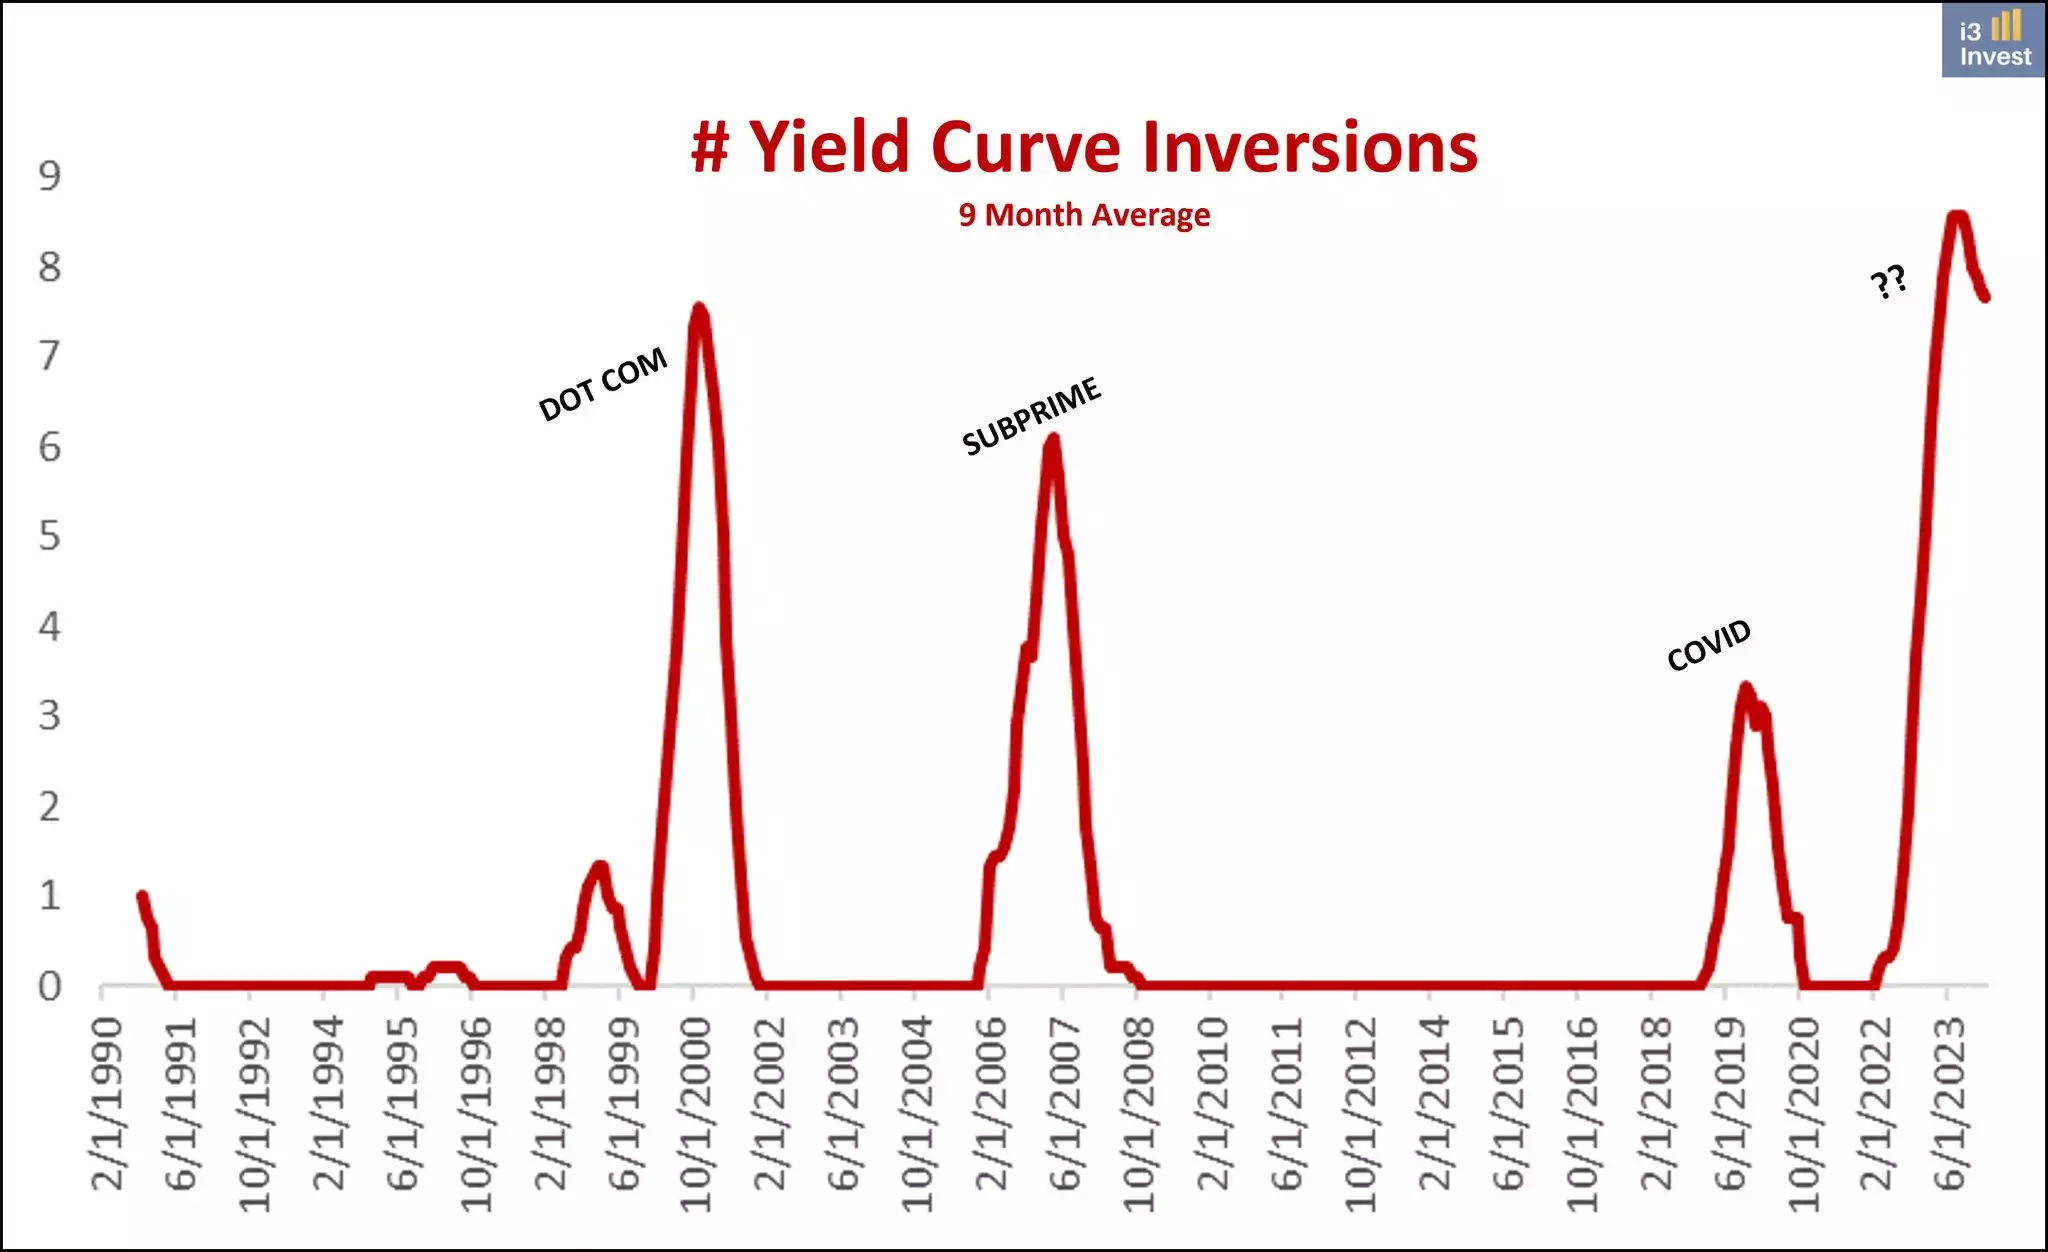
We are currently in the 4th worst longest in history. Below is another way to put it in more contemporary context where the average number exceeds GFC and dot.com.
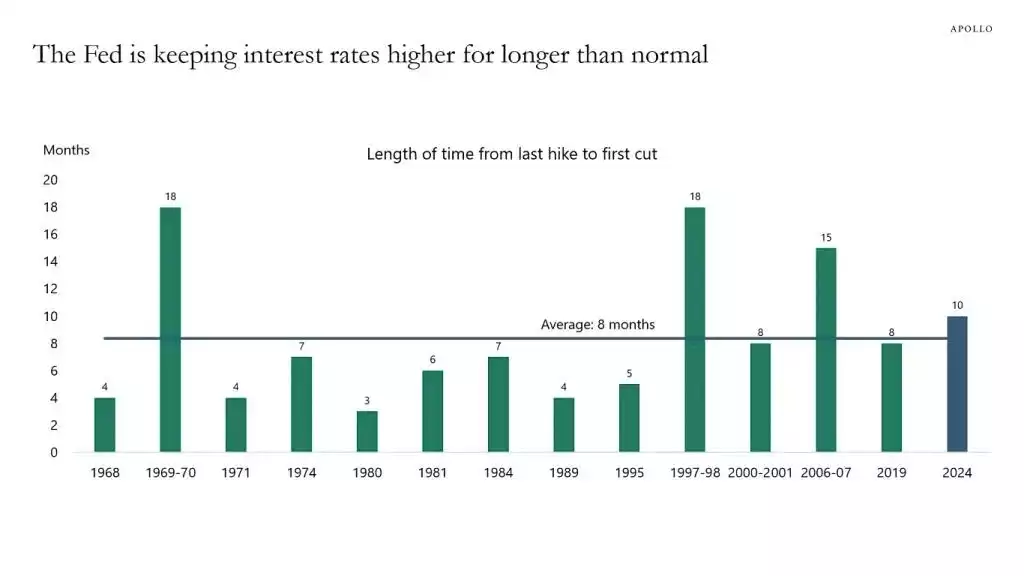
Looking at this another way, Torsten Slok points out:
"It normally takes eight months from the last Fed hike until the central bank starts cutting. But during this cycle, the Fed has kept interest rates constant for ten months since the last hike in July 2023."
Gold has no ‘right’ to be trading so high with such high rates, but it has been one of the top performers this year. Last night’s correction was overdue as it got a bit carried away on war fears which have since ‘abated’. That said, it is only retesting weekly lows. Gold remains so high because the market is looking through all of this and seeing the inevitable result on the other side… market turmoil and more liquidity unleashed.
This could be straight out QE, rate drops or the Fed doing a form of yield curve control, buying up short term bonds and selling longer term to ‘pay’ for it but on level, lowering short term yields either way. This before inflation is tamed just adds juice to the gold story.
Last week we saw Citigroup say, “We project $3,000/oz gold over the next 6-18m,” and Goldman Sachs increase its year end target to $2700 calling it an “unshakeable bull market”. For context gold is trading at $2330 in U.S. spot terms at the time of writing.
The fixation on the yield curve has abated only because it’s been inverted for so long and people fall into the trap of the 4 most expensive words in investment – this. time. is. different. It rarely is.