Why This Will Be the Worst Recession
News
|
Posted 13/08/2020
|
8147
ABOVE: View todays article from the Ainslie Youtube channel.
When people talk about the burden of debt we are leaving the future or the amount of stimulus bringing forward demand whilst further adding to that debt, consider the following fact just out of the US, the world’s largest economy:
Fiscal year to date, the US Government has spent $5.6 trillion dollars. In the same period, they had income via tax collected of $2.8 trillion. That’s right, they spent twice what they ‘earned’. That leaves an all time record high deficit of $2.8 trillion. And before we write this off as a short term helicopter money COVID handout issue, check out the break up below:
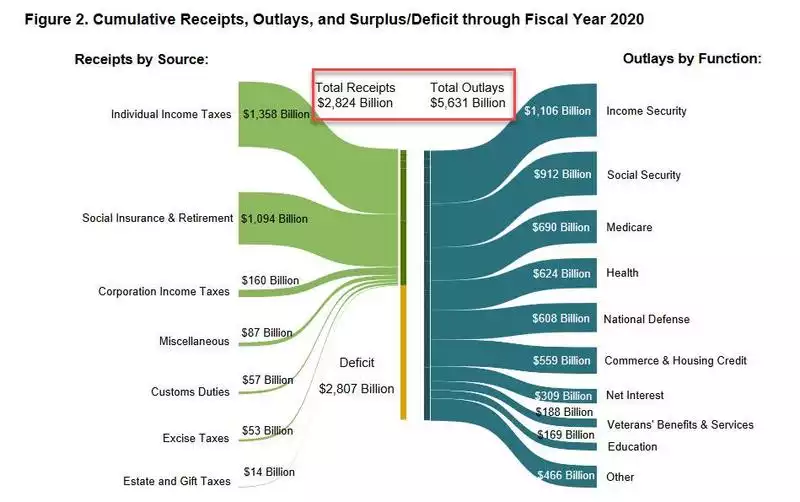
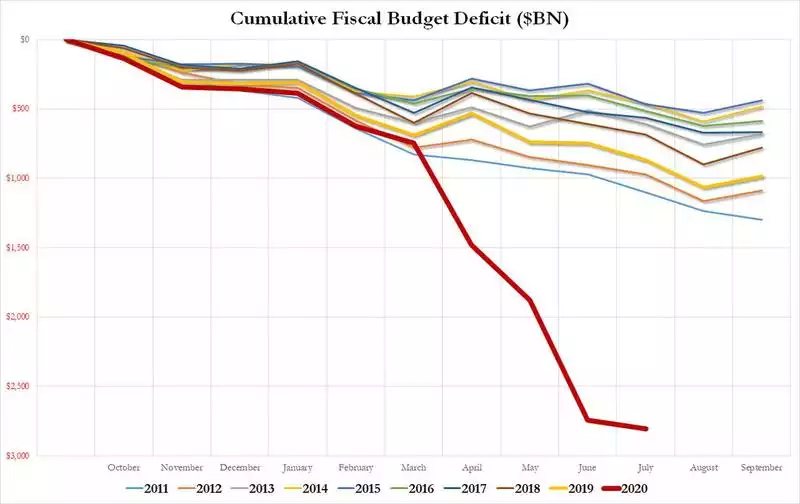
Whilst extraordinarily large, the Income Security portion is ‘just’ $1.1 trillion. As experts repeatedly remind us, things were not good BEFORE the virus, it was simply the straw that broke the camel’s back. The other observation is that anyone can see that this virus or its effects are not going away anytime soon as wave after wave hits. Likewise the Government support is not going away anytime soon. Modern Monetary Theory appears to be entrenching itself by stealth. Whilst we have a system now based on populist voting, few will vote for less free stuff. In other words there appears little in the way of an eventual collapse after massive inflation. Again to put this year into perspective but remind you of the fact it was bad beforehand, the following shows US deficits over the last decade.
The impacts however are more immediate that a ‘macro’ reset, however that looks. Eric Basmajian of EPB Macro Research wrote an in depth piece recently titled ““The Greatest Pull Forward In History”: Why This Recession Is Different, Similar & Worse”. His summary points are as follows:
- “The COVID recession resulted in the most significant “pull-forward” of income growth in modern history.
- An unprecedented amount of debt was used to plug a record output gap.
- This recession is different because income growth increased as opposed to declined. The similarity comes from the use of debt capital to blunt the negative impact of deflation.
- The outcome of the recession will ultimately be worse as the level of public and private indebtedness has breached all critical thresholds and will now have a non-linear impact on economic growth.
- Overusing one factor of the production function, specifically debt capital, has diminishing marginal returns and will result in the weakest expansionary income growth in the years to come.”
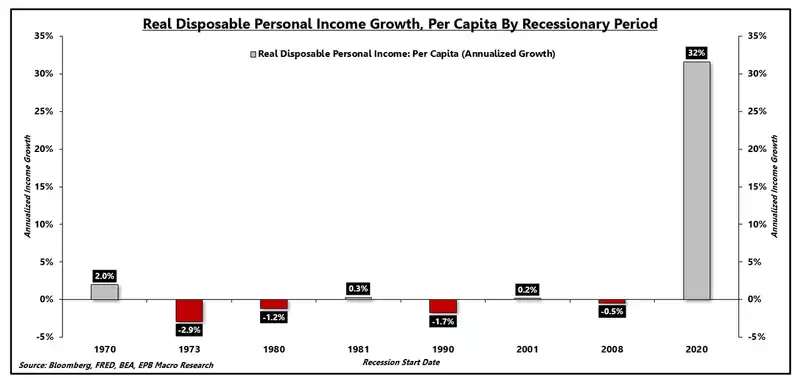
Summarising some key observations, there is a perception things are ok because of a false sense of security via all the handouts. In a normal recession real disposable income growth is near or below zero. Check out the sheer scale by comparison with all the helicopter money this time in the US:
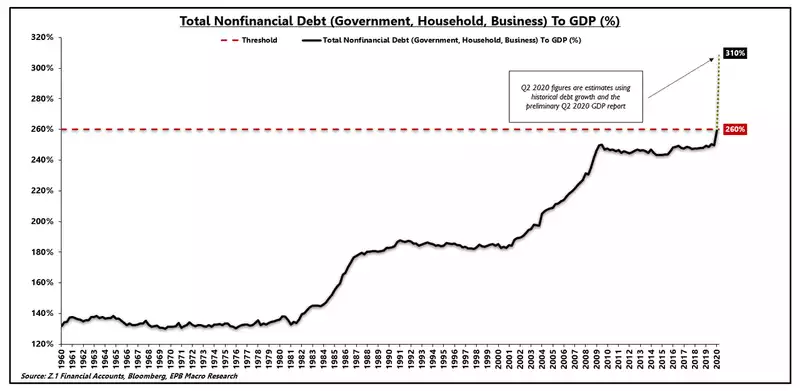
Basmajian goes on to look at the size of the US debt burden using the threshold of all non financial debt (government, private and business) against GDP of 300% spelt out by the Bank for International Settlements (the world’s central bank’s central bank). The abstract of that report says:
“At moderate levels, debt improves welfare and enhances growth. But high levels can be damaging. When does debt go from good to bad? We address this question using a new dataset that includes the level of government, non-financial corporate and household debt in 18 OECD countries from 1980 to 2010. Our results support the view that, beyond a certain level, debt is a drag on growth. For government debt, the threshold is around 85% of GDP. The immediate implication is that countries with high debt must act quickly and decisively to address their fiscal problems. The longer-term lesson is that, to build the fiscal buffer required to address extraordinary events, governments should keep debt well below the estimated thresholds. Our examination of other types of debt yields similar conclusions. When corporate debt goes beyond 90% of GDP, it becomes a drag on growth. And for household debt, we report a threshold around 85% of GDP, although the impact is very imprecisely estimated.”
In other words over 260% of GDP debt becomes are real drag, perpetuating a self fulfilling downward spiral. And so the following chart, showing the US at 310%, becomes one of great concern:
“Debt is simply a pull-forward of future consumption or rather an exchange of current consumption at the expense of future consumption. We are in the process of the greatest pull-forward of demand in history, and we continue to believe that because we are using “more” debt, or that because it is directed to a particular group of people rather than another group, that we can bypass the well-documented evidence of diminishing marginal returns.
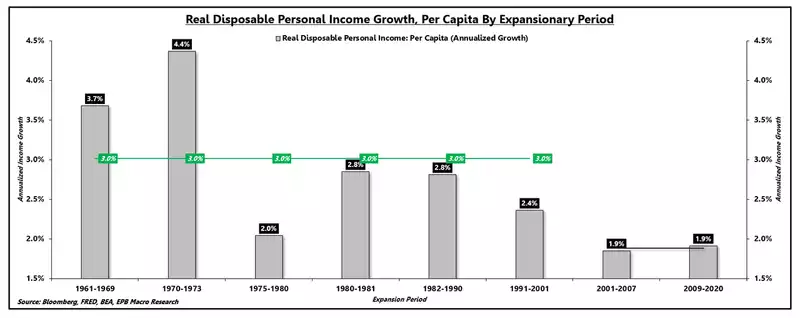
To see the evidence of diminishing marginal returns on full display, we can track the rate of real personal disposable income growth per capita, during only expansionary periods, throughout a period of time in which debt capital has been highly overused.
From the 1960s through the early 2000s, real personal disposable income growth per capita increased at a 3.0% annualized rate during expansionary periods. After the turn of the century, we lost 36% of our trend income growth, falling to just 1.9%. Many factors contributed to this decline, but diminishing marginal returns and an overuse of debt capital are among the main culprits.”
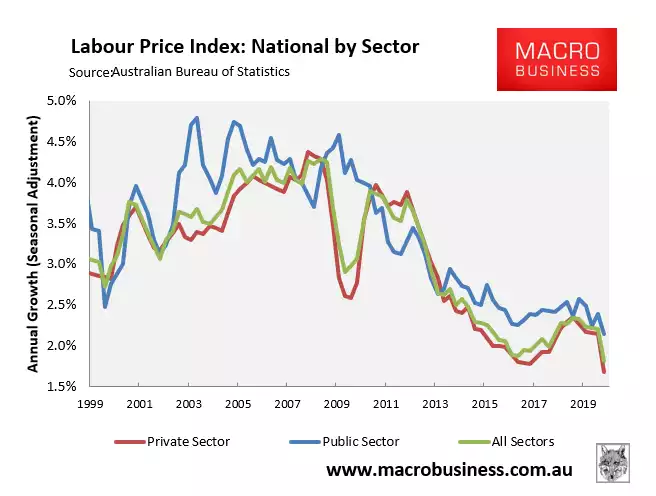
These are all US numbers and the story in Australia until this year was different. Whilst we had the world’s second highest personal debt levels our Government debt was low. That has, as you know, now changed. We still have the 2nd highest debt in the world, largely in housing which is declining in value, and now we have skyrocketing government debt to boot. Right on cue, yesterday we saw the latest ABS figures for wages and unsurprisingly wage growth hit an all time low.
In other words this is not just a US problem it is an ‘us’ problem too. Future returns on shares will suffer, house price growth will suffer, bonds have nowhere to go. It is no wonder people are flooding into gold and silver as one of the only assets set to gain on such an equation. We will leave you with his closing remarks:
“For many years, the solution to economic troubles has been bigger government stimulus packages. $1 trillion has become $2 trillion, and the last $2 trillion package lasted less than half a year. The evidence of diminishing marginal returns is again on full display as each stimulus effort is even more fleeting, requiring more extensive programs with greater regularity.
As Dr. Lacy Hunt said in his recent podcast with Grant Williams, “economics is not accounting. We have to grapple with nonlinearities.”
Income growth has increased during this recession, a distinct difference from the normal recessionary template. The use of debt capital, specifically government debt capital, to blunt the impact of deflation is a page out of the same playbook the economy has been using for several decades.
The resulting degradation of income growth during the next expansionary period will be worse than prior episodes as we have pushed the level of indebtedness past all critical and well-studied thresholds.
We should continue to prepare for anaemic real income growth and the knock-on effects that dynamic will bring to asset prices.”