Why May Was Different to December
News
|
Posted 02/06/2016
|
5064
There is something very similar about the price action on gold right now and in the lead up to the December US rate hike as the graph below shows:
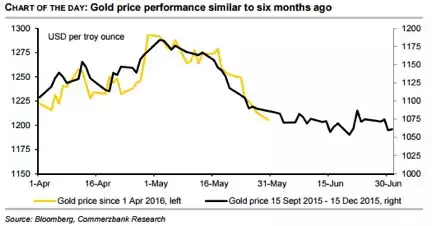
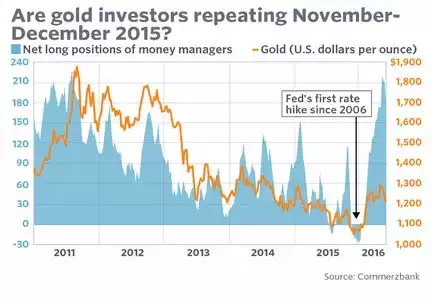
The settings are similar. At the end of October 2015 we saw US Fed minutes clearly increasing the odds of a December hike, just like we did for the April meeting this year. We subsequently saw gold sell off from $1200 to $1050. May just saw gold come off 5.9%, its worst month since, you guessed it, November 2015 but importantly it didn’t breach the support of $1200. However the analysts who produced the above graph at Commerzbank point out one key difference this time. Gold ETF’s (such as GLD) saw more big inflows in May this year (80 tonne) whereas November 2015 saw 50 tonnes outflows. This reinforces Citi’s advice yesterday that many seeing this as a ‘buy the dip’ opportunity. Indeed if you consider the graph below, whilst the Managed Money (financial speculators) net longs on COMEX dropped by a record 56,000 contracts to 24 May, you can see below they are still well and truly net long (betting on a rise), whereas last December they went net short. As we reported Monday, there are 2 ways to look at this and some might actually want to see those speculators net short again before feeling this correction is over. However as we pointed out yesterday there are a number of Black Swans circling right now that could see that all evaporate and the rush to safety overcome.