Why Gold Fell & Where to Now
News
|
Posted 27/06/2017
|
8362
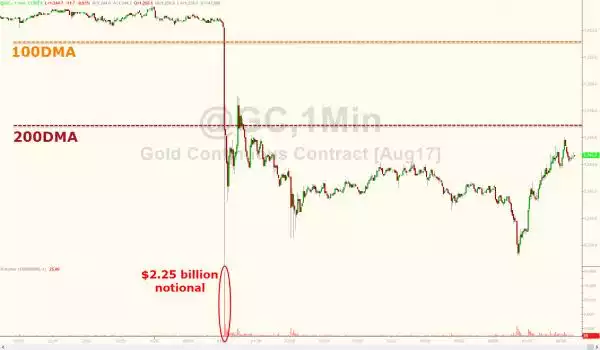
Avid watchers of the gold and silver prices got a nasty shock around 7pm last night as both metals free fell in minutes, gold down $12 and silver around 20c. The reason? One of those ‘fat finger’ moments when $2.2b or 50t of gold futures (purely paper trades) were dumped onto the market for no apparent reason. Jim Rickards quipped on Twitter:
“#Gold down 1% on sale of 50 tons of "paper" on COMEX. FYI, last time anyone quickly sourced 50 tons of physical was NATO invasion of Libya.”
But what followed was unusual. Goldman Sachs released a reported supportive of gold. Their 3 main reasons:
“1. lower returns in US equity (as we expect) should support a more defensive investor allocation,
2. EM [Emerging Markets] $GDP acceleration would add purchasing power to EM economies with high propensity to consume gold, and
3. Goldman Sachs expects gold mine supply to peak in 2017.”
Citi Bank’s analysts then came out with a technical view that “we have confirmed triple weekly momentum divergence on Gold and as a reminder, this is one of our favourite indicators to suggest that a trend (downtrend in this case) is running out of steam.”
In one foul swoop last night gold broke down through both it’s 100 and 200 Daily Moving Averages (DMA) as you can see from the first chart below (and while you’re at it, check out the volume on ‘that’ trade).
The triple they talk of is the convergence of the 200DMA, WMA and the 76.4% Fibonacci Retracement…
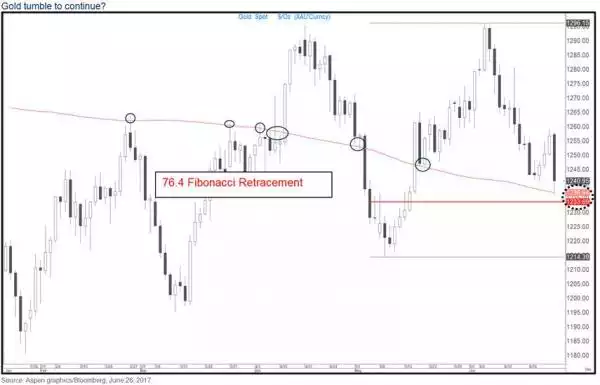
You will note too in this chart that the higher lows and higher highs trend is still intact which is technically an important sign that the bottom is still in and the upward trajectory (albeit 2 steps forward, 1 back at the moment) looks good.
As usual silver got taken for the ride on all of this but rebounded more strongely than gold. Those waiting to buy dips will be happy, but as the above suggests, each dip is getting higher.