When the Worm Turns – Gas meet Match
News
|
Posted 29/10/2019
|
12122
It wasn’t that long ago when mainstream news was awash with the inversion of the yield curve (we last wrote here) and its historically reliable foretelling of an imminent recession. Likewise we saw US share traders going ‘all in’ with margin lending at all time highs, often a sign of ‘irrational exuberance’ (explained here and a great analysis here).
However what history is also clear on, is that a crash or recession does not normally occur when the yield curve inverts or margin lending peaks, it is when things start to reverse that trend. You may call it the ‘oh sh#t’ moment when irrational exuberance turns to concern and the smart money starts to exit left.
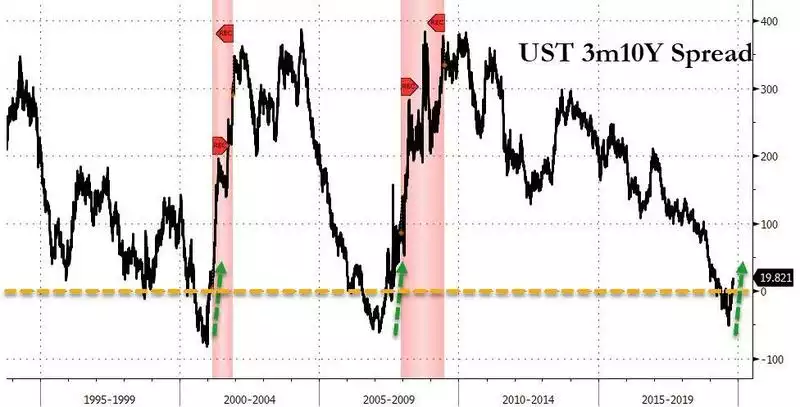
So where are we now? Firstly, we have seen the US Treasury yield curve inversion reverse:

That could well be early days and it may well whipsaw around a bit as it did before the GFC, but as you can see from the dot.com bubble in 2001, sometimes it gives very little warning at all.
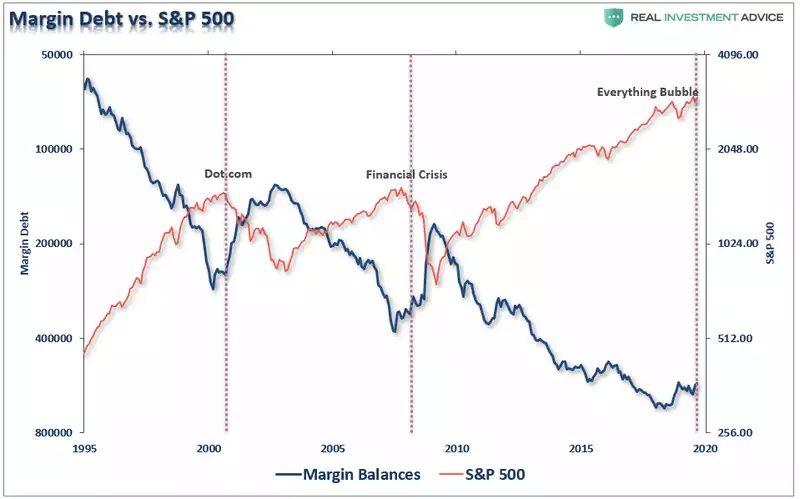
So what about margin debt? Below is a chart showing the S&P500 against a margin debt (inverted). Yet again we are seeing the same reversal that preceded the last 2 crashes:

Please take the time to note the sheer scale of debt thrown at this current sharemarket bull run. That should not be surprising on one level as debt has never been cheaper and many believe the central bank monetary stimulus driving it will always somehow save the day. That of course is great if you think there is such an economic phenomenon as ‘this time is different’.
The thing with margin debt is that it removes discretion from the equation. When the issuers of that debt get concerned about your collateral (the value of your shares that are dropping) they force you to either tip in more cash (immediately) or sell your shares to reduce your exposure, or if you don’t, they can and do sell without asking. One can easily foresee (and history gives us plenty of real life examples) the liquidation cycle that ensues. That very forced selling then forces the market down further, further reducing the value of your collateral, triggering more margin calls, and down the slippery spiral we go to an outright crash.
Another dynamic in all of this to be mindful of is the tightening of credit markets possibly not even triggered by or proportional to the drop of the value of your collateral. The recent pressures in the repo market that have seen the Fed tipping in $billions nightly to support it is a clear example of banks not trusting other banks. Enter the institutional ‘counterparty risk’ dynamic, not just the margin borrower risk. Banks can simply change their risk exposure metrics when they get concerned about counterparty risk. That’s why they are not lending to each other on the overnight repo market and the Fed has had to step in. Yesterday we talked about the counterparty risk in the $550 trillion derivatives market. Last week we talked about the $10 trillion and deteriorating US corporate bond market. Last week we talked about that repo market and the shadow banking market as well. Joining the dots is not particularly hard here. All of these threats are linked through the financial institutions issuing the very debt inflating and leveraging this all-time high sharemarket. As the world takes on more and more debt, in excess of underlying economic growth, they need to get more and more creative. Knowing what each is doing they get more concerned about the counterparty risk. Yes the irony is not lost but neither are the implications of just one spanner in the works.
The author of that second chart above, Lance Roberts notes:
“Investors can leverage their existing portfolios and increase buying power to participate in rising markets. While “this time could certainly be different,” the reality is that leverage of this magnitude is “gasoline waiting on a match.”