When the “super bubble” pops
News
|
Posted 15/08/2022
|
7625
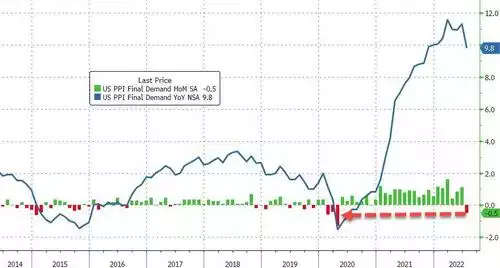
US shares rallied again Friday night largely it seems off the back of a slightly softer PPI (Producer Price Index – i.e. inflation at the ‘factory door’). The market desperately looking for confirmation bias around an imminent Fed pivot got what they were looking for and bought up. However, this same market doesn’t seem to be grasping the implications of a 9.8% PPI print amid 8.5% CPI and a weakening economy.
First, for some context, lets look at the PPI print on an historical basis. We have now seen 27 straight monthly increases..
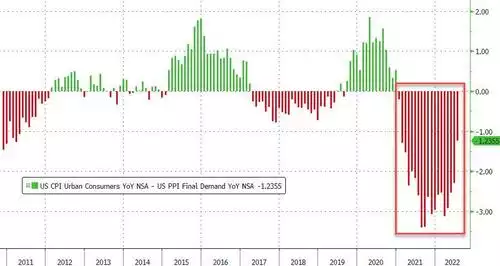
Now let’s see how it’s tracking against CPI… 19 straight months of input costs growth exceeding income growth…
And so whilst shares are going up – an investment in the future earnings of companies – the pressure on those very future earnings amid protracted margin squeeze seen above and in combination with the recessionary pressures in the US, one has to ask the simple question. Why?
Lance Roberts of Real Investment Advice asks a similar question.
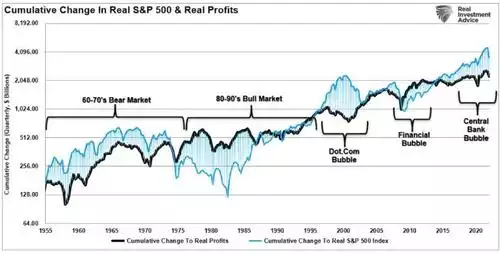
“While not precise, there is a correlation between economic activity and the rise and fall of equity prices. For example, in 2000 and again in 2008, earnings contracted by 54% and 88%, respectively, as economic growth declined. Such was despite calls of never-ending earnings growth before both previous contractions.”
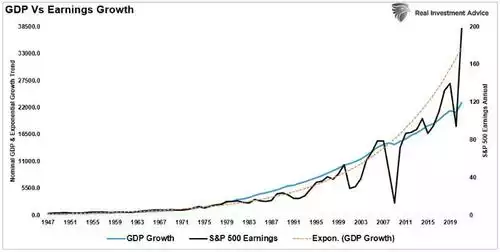
“As earnings disappointed, stock prices adjusted by nearly 50% to realign valuations with weaker than expected current earnings and slower future earnings growth. So while the stock market is once again detached from reality, looking at past earnings contractions suggests it won’t be the case for long.”
And so we are seeing the results of this massive bubble the Fed and other central banks have blown. Roberts quotes Wall St legend Jeremy Grantham from earlier this year:
“All 2-sigma equity bubbles in developed countries have broken back to trend. But before they did, a handful went on to become superbubbles of 3-sigma or greater: in the U.S. in 1929 and 2000 and in Japan in 1989. There were also superbubbles in housing in the U.S. in 2006 and Japan in 1989. All five of these superbubbles corrected all the way back to trend with much greater and longer pain than average.
Today in the U.S. we are in the fourth superbubble of the last hundred years.”
Indeed it was Grantham who once noted this immutable fact:
“Profit margins are probably the most mean-reverting series in finance. And if profit margins do not mean-revert, then something has gone badly wrong with capitalism. If high profits do not attract competition, there is something wrong with the system, and it is not functioning properly.”
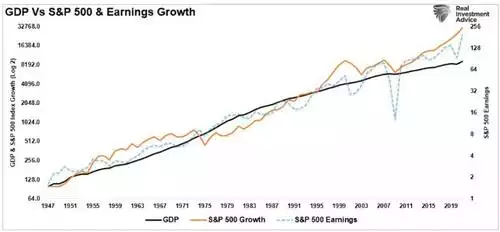
The following chart so clearly shows the grotesque disconnect in a market that people are openly questioning whether the ‘correction is over’. It clearly suggests the correction has barely begun…
And finally, to bring together why the market is so fixated on whether the Fed will pause or pivot on this tightening cycle and rally on hope of said pivot despite clear recession and earnings pressures, look no further than the roadmap of how we got here in the first place. Its ALL about the Fed’s unprecedented money printing campaign since the GFC…
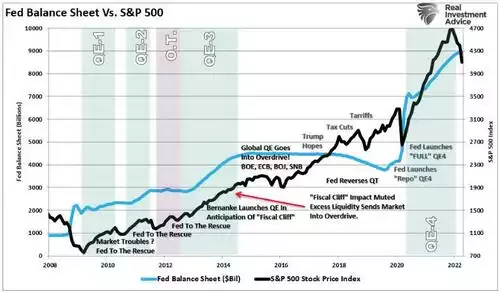
Watch out below..
************************************************************************************
GOT A QUESTION about today's news?
This afternoon, the Gold & Silver Standard Insights team will be breaking down the news and answering YOUR questions.
Submit your question to [email protected] and SUBSCRIBE to the YouTube Channel to be notified when the GSS Insights video is live.
**********************************************************************************