WGC - Gold Demand Trends Q1 2021
News
|
Posted 30/04/2021
|
7336
The World Gold Council have just released their quarterly update on gold demand and supply and we summarise with key excerpts as follows:
The US dollar gold price fell by 10% during Q1. The recent downward trend was fuelled in part by ETF outflows and a reduction in net long positioning in the futures market, but strong consumer demand helped to provide support.

ETF’s
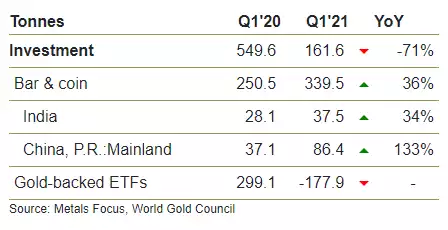
Global gold ETF holdings fell by 177.9t (US$9.5bn). Western markets drove outflows as US rates rose sharply and the US dollar strengthened.

Bullion
Demand for gold bars and coins saw a third successive quarter of growth. Investment in these products reached 339.5t – the highest quarter since Q4 2016. Bar and coin investment was buoyed by the opportunity to buy at lower prices, as well as by expectations of building inflationary pressures. Bargain-hunting in key markets, notably China, was a major driver of growth in this sector of demand as the gold price fell back from the 2020 peak. Fear over rising inflationary pressures was an added driver, as economies around the world responded to the massive fiscal and monetary stimulus introduced to combat the worst impacts of the pandemic.

As you can see from the table below China’s bar and coin demand totalled 86t in Q1 – 133% higher y-o-y and 21% higher than Q1 2019. We discussed how this is likely just the beginning of renewed Chinese demand recently here.
Jewellery
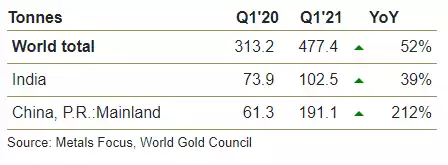
Jewellery demand totalled 477.4t in Q1, up 52% y-o-y – a strong improvement compared with the historically weak Q1 2020. Demand remains muted on a longer-term basis, 6% below the five-year quarterly average of 505.9t. India and China were the engines of recovery, generating the vast majority of global y-o-y growth.
Central Banks
Global central bank gold reserves grew 95.5t in Q1. Hungary’s large purchase (+63t) bolstered Q1 buying, more than matching Turkey’s substantial sale (31.5t).

Hungary, the biggest buyer of the quarter, hadn’t bought gold since 2018 and stated they were “Managing new risks arising from the coronavirus pandemic also played a key role in the decision. The appearance of global spikes in government debts or inflation concerns further increase the importance of gold in national strategy as a safe-haven asset and as a store of value.”
Technology
Demand in the technology sector during Q1 rose by 11% y-o-y to 81.2t. The electronics sector, which accounts for the majority of industrial gold demand, registered 13% growth y-o-y to 66.4t. Other industrial demand grew by 9% y-o-y to 12t, while dental demand continued its slow decline, falling 9% to 2.9t.
Supply
Q1 mine production increased 4% y-o-y as coronavirus disruptions abated however the base effects of that coming off a much lower base due to COVID shutdowns meant the total was not materially different to historic rates. Recycled gold supply fell 8% y-o-y due to weaker gold prices and diminished stocks. Producer de-hedging of 25t was noted, continuing the full year 2020 trend.

As we sit here now amid rampant monetary expansion with no end in sight, the above chart is a salient reminder of the reason gold is real money through scarcity. On average over the longer term the supply of gold expands by around just 2% each year. The chart above also reinforces the widely held belief that we saw ‘peak gold’ in or around 2015/16. You can see the downward trend since. The key takeaway is that whilst the fleeting Wall St money is leaving ETF’s for bubble like financial assets, the strong hands are buying up physical in the dip at a strong rate despite the ‘everything’s awesome’ narrative.