WGC – Gold Demand Trends Q2 2019
News
|
Posted 02/08/2019
|
9600
Last night gold smashed through AUD2100 with gusto, sitting at $2125 as we write, up nearly 2.5% overnight. Likewise silver pushed through AUD24 but half the percentage gains of gold pushing the GSR back up to 88. Channel 7 news ran a story on gold’s price last night including an interview with us and some nice pics of our gold and silver. Market sentiment is most definitely on the improve.
Looking more broadly, yesterday the World Gold Council released their Q2 2019 Gold Demand Trends report. To say gold demand is strong would be an understatement and as usual we provide a summary of their report.

Central Banks
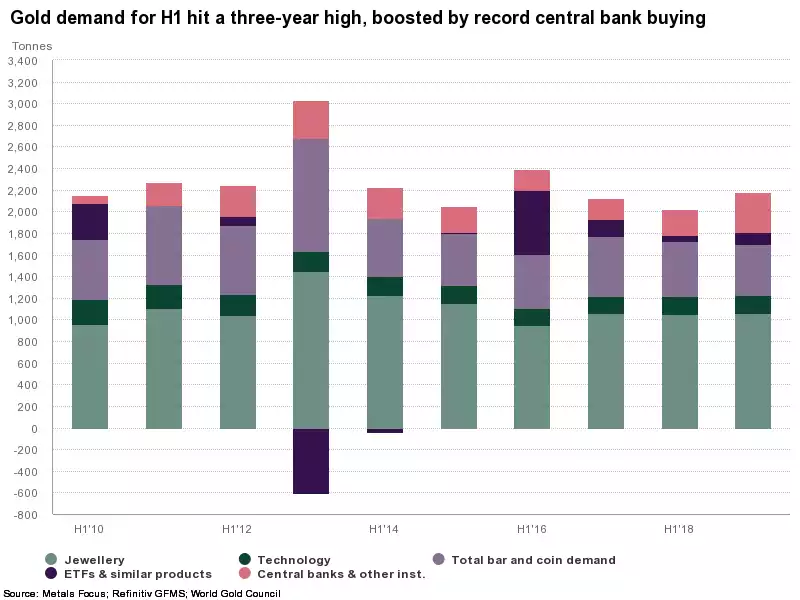
Central banks bought 224.4t of gold in Q2 2019. This took H1 buying to 374.1t – the largest net H1 increase in global gold reserves in our 19-year quarterly data series. Buying was again spread across a diverse range of – largely emerging market – countries.
Investment
Holdings of gold-backed ETFs grew 67.2t in Q2 to a six-year high of 2,548t. The main factors driving inflows into the sector were continued geopolitical instability, expectation of lower interest rates, and the rallying gold price in June.
Bar and coin investment in Q2 sank 12% to 218.6t put down largely to profit taking and waiting for a correction. Combined with the soft Q1 number, the H1 total ended at a ten-year low of 476.9t. A 29% y-o-y drop in China accounted for much of the global Q2 decline.
Jewellery
A strong recovery in India’s jewellery market pushed demand in Q2 up 12% to 168.8t. A busy wedding season and healthy festival sales boosted demand, before the June price rise brought it to a virtual standstill. Indian demand drove global jewellery demand 2% higher y-o-y to 531.7t.
Technology
The total volume of gold used in the technology sector fell to 81.1t during Q2, a 3% y-o-y decline. This was the third consecutive quarter of falling demand, due to a range of challenges in the electronics sector, including the ongoing trade dispute between China and the US. However, there are signs of recovery and we expect declines to continue to slow throughout H2 2019.
Supply
Gold supply grew 6% in Q2 to 1,186.7t. A record 882.6t for Q2 gold mine production and a 9% jump in recycling to 314.6t – boosted by the sharp June gold price rally – led the growth in supply. H1 supply reached 2,323.9t – the highest since 2016. The record high AUD gold price saw Australian miners the most active hedgers in the period. Interestingly, whilst most countries saw gains in production, China, the world’s largest producer, saw another quarter of declines, down another 4%. Whilst Chinese bar demand was weaker in the period, this trend may see China turn to more imports as they continue to accumulate gold faster than any other.