Traditional Market Jitters Hit Crypto. Technical Data Remains Strong
News
|
Posted 21/09/2021
|
5577
The Bitcoin market traded slightly higher this week, opening at a low of $43,789 US, and trading up to an intra-day high of $48,730. Prices are forming a consolidation trading range after the volatile sell-off that started the previous week, clearing $4B in excess leverage in one hour.
The Bitcoin market finds itself amidst a macroeconomic landscape punctuated by growing uncertainties in Chinese credit markets, and downside price action for traditional equities over the week. Despite this backdrop, Bitcoin price action, and on-chain investor responses appear relatively robust.
As noted by Glassnode in their latest weekly report:
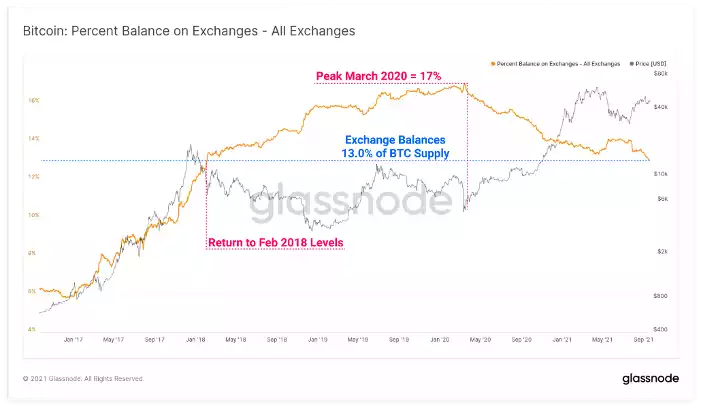
Exchange Balances Continue Outflows
Whilst there is spending behaviour observable amongst the existing cohort of Bitcoin holders, it appears there is even more demand for coins accumulated from exchange balances.
Overall exchange balances have continued to decline this week, reaching a new multi-year low of 13.0% of circulating supply this week. This returns exchange balances to levels last seen in Feb 2018. Keep in mind that prices were trading between $6k and $10k at that time. The accumulation of coins after March 2020, with prices trading up from $3.8k to over $64k in April, reflects the significant growth of capital inflows necessary to withdraw this relative coin volume.
Supporting this observation, is a deeply negative (outflows) exchange net-flow reading this week, with current BTC outflows occurring at a rate of -92k BTC/month. Similar to the exchange balance chart above, the market shifted paradigm after March 2020, from a regime of net exchange inflow dominance to outflow dominance.
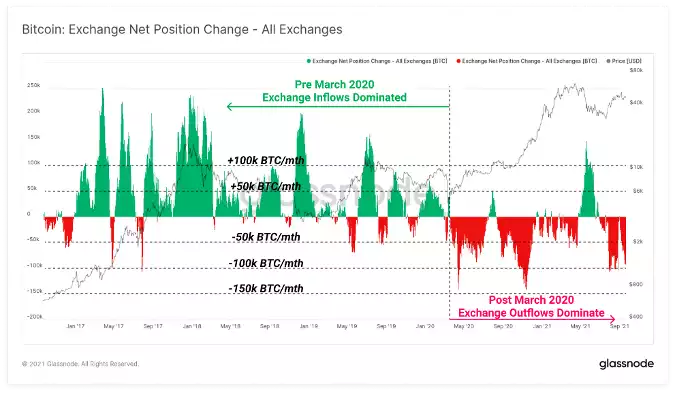
What we can see from this data is that the market participants who are selling at the moment are (a) selling at a loss and (b) selling to higher conviction buyers, who are then withdrawing from exchanges to cold wallets.
Glassnode adds clarification to the modest realisation of profits and small realisation of losses saying the following:
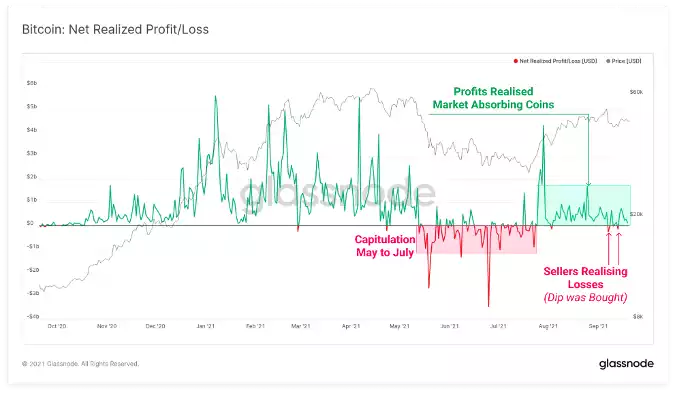
In on-chain analysis, we often build models upon the concept of 'realised value' for a coin, that is the price at which a UTXO, containing some volume of BTC, was created. Another way to consider this is the price at which a coin last moved, thus reflecting the on-chain 'cost basis' for that coin.
When a coin is spent at a later time, we can assess the difference between the original realised price, and the current spent price to assess if the owner is realising a profit or a loss. The aggregate value of all coins spent that day provides an estimate on the volume of capital flowing into the market, as every seller is by definition matched with a buyer.
Since late July, the market has consistently realised net profits on the order of around $1B per day as prices rallied from $31k to over $52k. This suggests a relatively meaningful bid has supported the market on the way up.
Despite the incredible strength that is found in technical data for BTC, the fundamental markets have shown signs of weakness, bringing down “risky” assets with it. This sell-off is the continuation of a well-established pattern where traders cash in their riskier assets to cover margin calls or sit on the sidelines until markets calm down and they feel more comfortable going back into riskier positions. Past data shows September dips pave the way for larger bull runs, particularly those seen after a halving year. Bitcoin underwent its third mining-reward halving in May last year. The first and the second halvings took place in 2012 and 2016.
BTC, from a technical point of view, certainly wants to make another push up towards the all-time highs but is fighting again headwinds in the traditional markets. What this could provide is a textbook “buy the dip” situation for investors who are attempting to begin building their crypto portfolio or add to their existing portfolio. Could be an interesting week ahead…