The Great Rotation Into Metals
News
|
Posted 20/12/2021
|
7278
We’ve mentioned the ‘perverse distortions’ currently fundamental to the current market set up. Such distortions are seeing some financial assets and property at ridiculous highs and all on the back of record debt levels at near zero rates. With interest rates looking set to rise amid said debt it is prudent to remind ourselves in a few telling charts where we are at and where gold and silver sit amongst it.
First lets look at the sheer scale of margin debt sitting behind these post all time high US sharemarkets…
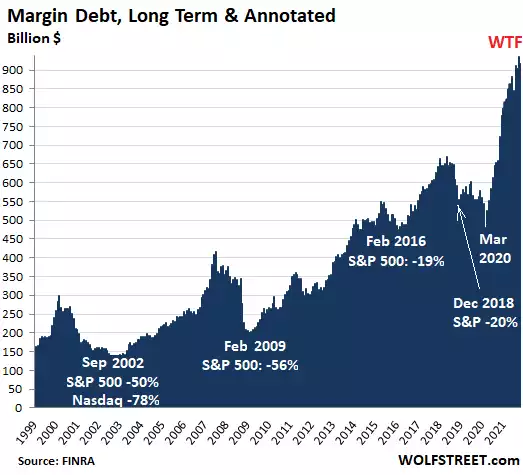
As incredible as the dollar amount is, it’s the extent and the pace of rise since COVID that is truly breathtaking.
But is has rolled over and it’s the aftermath of rollovers that historically flag crashes. In percentage of change terms, there have only been two months in history where it was higher than the recent high and one other even close. Each preceded the dot.com and GFC crashes…
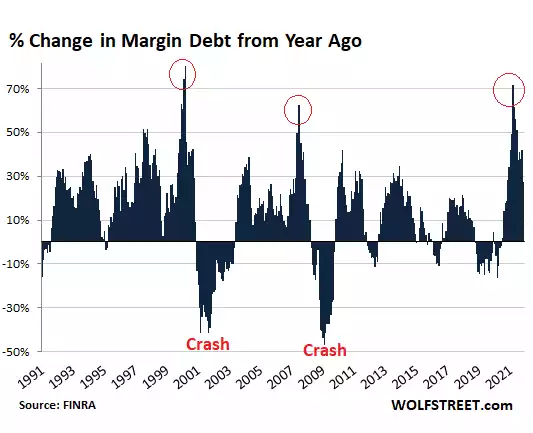
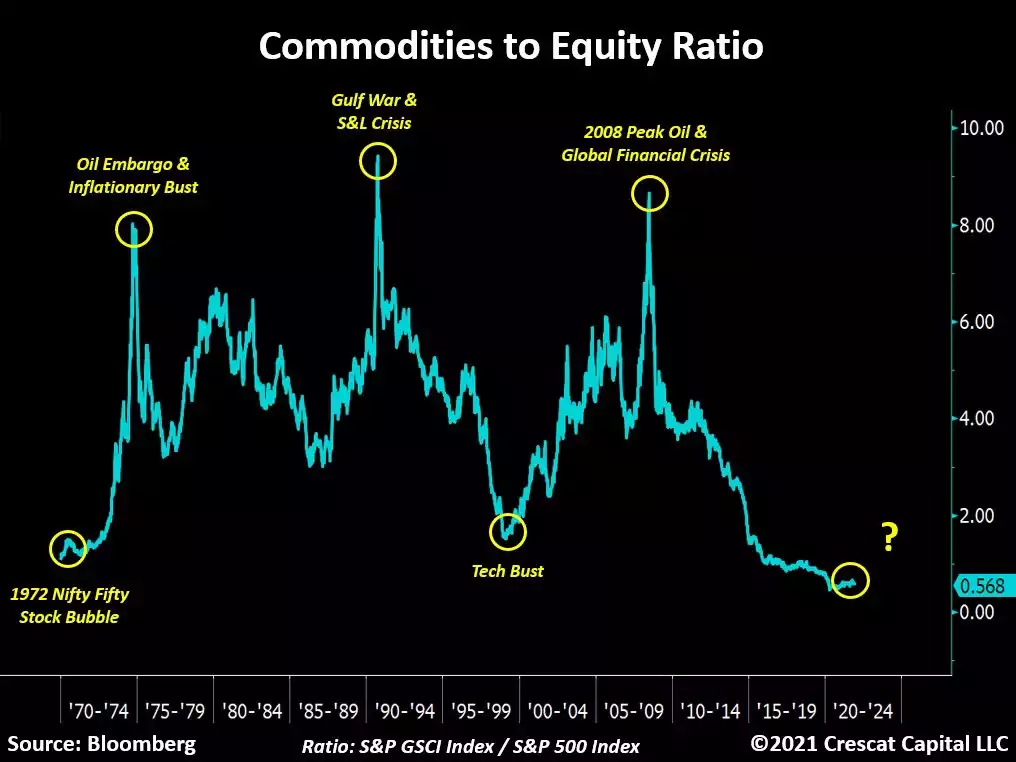
And so it should not come as a massive surprise that whilst hot margin money has been chasing growth shares, real value, real asset commodities have lagged comparatively….
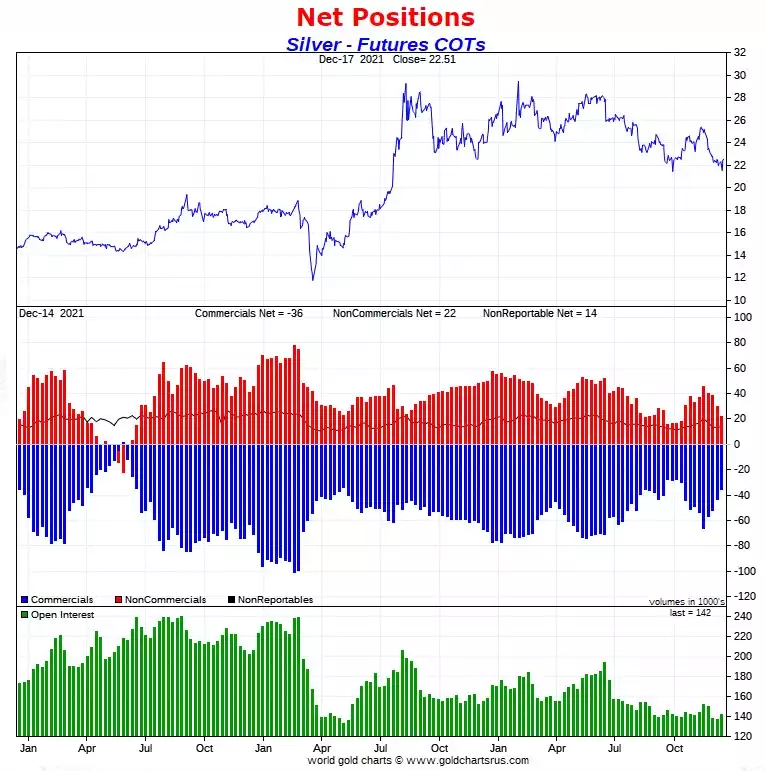
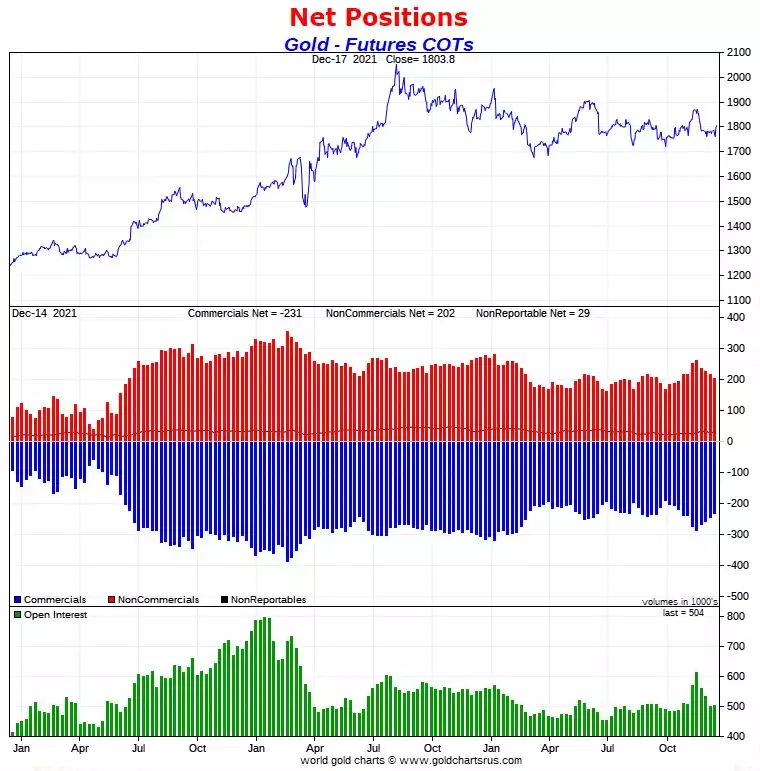
You will note this could have already turned or in the process of. That this coincides with the ‘smart’ commercial traders on COMEX having hugely reduced their short futures contract positions onto the managed money is potentially hugely telling. You will note below the coincidence of such lows in their positions with lows in the price and that this report is only to last Tuesday, when we saw that brief low dip into the USD21’s.
The set up for gold isn’t quite as insanely bullish but that again shouldn’t surprise at a gold silver ratio of 80! Gold has been range bound around 1800 all year but a take off in silver often coincides.
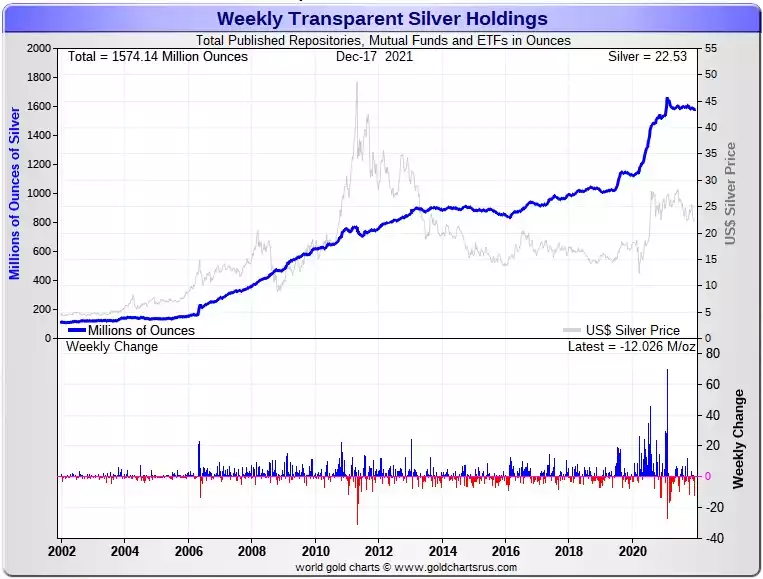
And the big players are taking silver out of the big ETF SLV in tonnes…
Is this that time we will look back at that commodities v equities chart and say ‘wow, that was such a clear flag!’?