The Everything Bubble about to pop?
News
|
Posted 22/09/2017
|
7879
As a follow on from yesterday’s insightful article we are compelled to revisit the share valuation situation at present. Last time we looked at this (here) we presented a range of valuation methods that showed this current market at 2nd to 3rd highest in history. Those vals were all based on arithmetic means which, some argue, can be skewed by outlier events and that using the median, or simply the middle of a set of ranked numbers, is more appropriate.
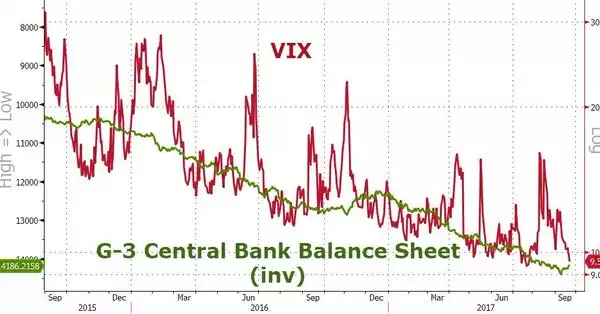
Meritocracy Capital agree and produce what they call the CAPME ratio which is the Price to Median 10 year Earnings. Rather than 2nd to 3rd worst in history, this measure shows it ‘only’ to be the 4th highest in 135 years. Phew! We can all relax now and buy more shares…. Oh, just a minute… we ARE all relaxed! Check out the chart of the VIX (volatility index) below. That green line is an inverse of the balance sheets of the 3 top central banks (it drops as they print more money….). Can you spot the trend? We are all relaxed because central banks ‘have our back’. And now just a reminder that the Fed announced this week they will start to unwind (make the green line go up) theirs… What could possibly go wrong?
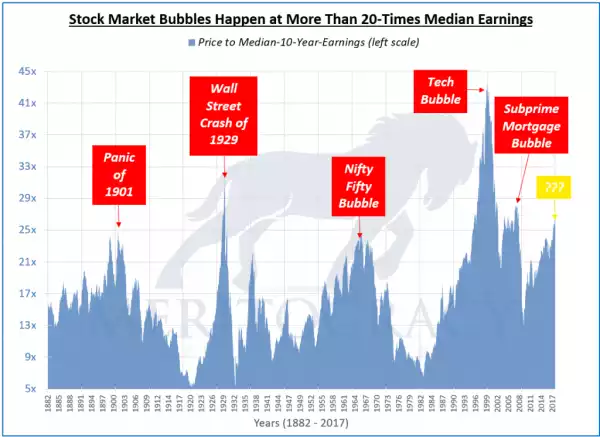
So let’s look at the CAPME plotted over the last 135 years:
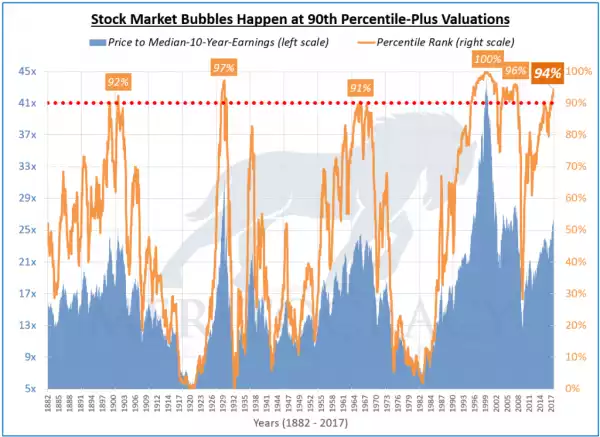
That yellow question mark bubble has been affectionately called the “Everything Bubble” or the “Central Bankers Bubble”. A clearer picture is formed ranking each on its valuation by percentile, again taking in the ‘outlier effect’ of that enormous dot com 41+ CAPME val. The following graph shows this and highlights the last 5 major crashes have occurred when the CAPME exceeds the 90th percentile. You will also note we are, right now, at the 94th percentile.
For the ‘its different this time’ crowd who argue we have never seen interest rates so low and that is why this time is different, the author of these graphs responds:
“This argument does not work for me. Let me tell you why. Yields on 10-year U.S. treasury bonds in early-1941 were lower than they are now. Despite lower interest rates in early-1941, the stock market CAPME valuation ratio was quite low at that time ranking at around the 30th percentile. Furthermore, the amount of debt provided by stock brokers used to fuel the current stock market cycle is at a record level. This could prove problematic given bubbles driven by financial leverage are particularly dangerous.”
If you didn’t click on the link to our last article on this you should. (again here) As we show exactly what he is talking about with that record high margin debt on shares. It’s eye watering. His conclusion?
“Summary
The aforementioned 5 stock market cycles turned into bubbles when their CAPME valuation ratios reached the 90th percentile. The U.S. stock market is back there again. Its valuation is squarely in the middle of that very expensive decile looking back 135 years.
The 5 previous instances of stock market bubbles suggest this will not end well. Bubbles never do, particularly ones driven by financial leverage.”