The “Full Employment” Fallacy
News
|
Posted 01/06/2017
|
5950
It’s that time of the month where we are just one day from the US’s official employment figures via the non farm payrolls (NFP) print due Friday night our time. The setting is a US Fed keen to not lose face and follow through with a rate hike at their 13-14 June meeting. However there have been a number of quite ordinary economic data prints of late and analysts yet again revising down GDP estimates after the very ordinary 0.7% print last quarter. A lot is riding on a good NFP print to justify taking more ‘tightening’ medicine.
The last print in April was a solid 211,000 new jobs and saw the unemployment rate drop to just 4.4%, its lowest since May 2007 and considered by most as “full employment”. Sounds awesome yeah? Well for a start the unemployment rate was helped by another drop in participation with the number of Americans simply not in the workforce rising to 94.375m. Apparently you don’t count if you give up... The other red flag was yet another drop in the average hourly earnings – wage growth continues to stall. On this point we came across a very insightful article titled “Simple (economic) Math” by Jeffrey Snider of Alhambra Investments.
Snider argues that talk of the US having ‘full employment’ because of a 4.4% official rate is nonsense, evidenced by the simple fact that wages growth is so low, the real economy is fundamentally weak, and corporate cash flow (basic earnings) is seeing little to no growth. Let’s look at a couple of charts from the article. The first shows what would normally happen to wage growth in a ‘full employment’ environment and what is happening now.
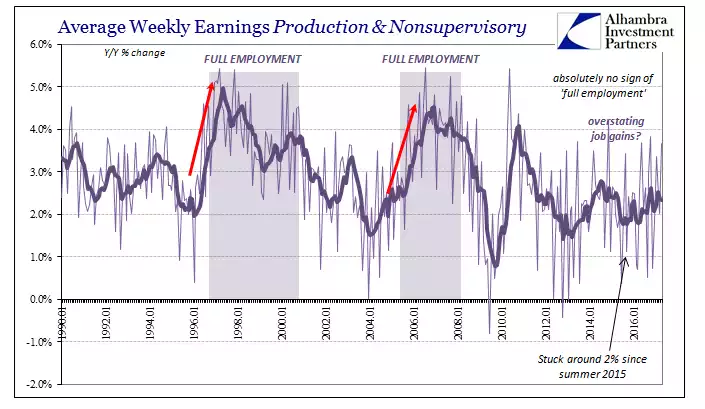
Snider summarises nicely the simple math that businesses are no longer willing to afford labour – “Anyone will take all the cheapest possible labour they can get, but it takes an actually growing economy with widespread, plausibly sustainable gains to give employers an impetus to actually pay market-clearing rates. That is the simple, small “e” economics left off the pageviews. “We could produce more product” has never in the past stopped businesses from paying up for labor, but it does now because there is no actual economic growth.”
For over half a century, in our post world war era, the US enjoyed, on average, a steady 2% growth rate measured against corporate cashflow below:
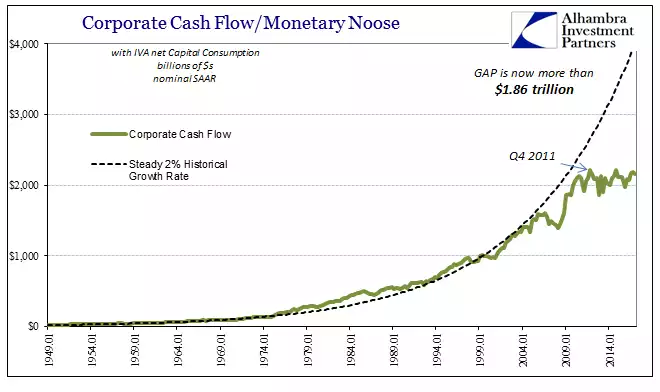
Since the GFC that trend has been broken despite the efforts of Quantitative Easing (QE - money printing) and ARRA (American Recovery and Reinvestment Act 2009 – another debt funded government spending stimulus plan post GFC).
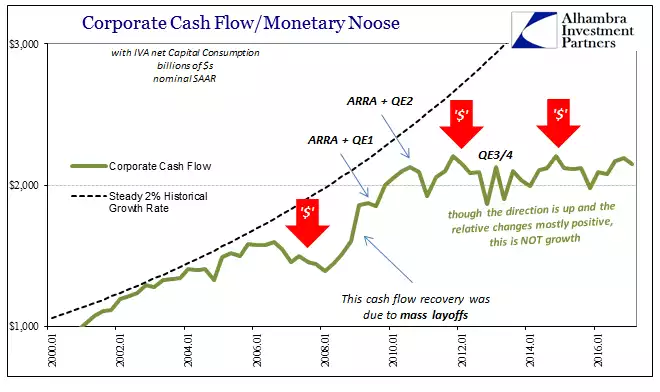
We are seeing a confluence of businesses not hiring so people can buy more things, and people not buying more things allowing businesses to hire more people.
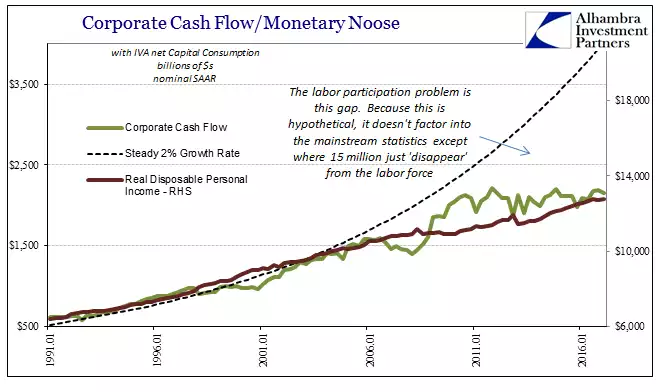
The note in the chart above addresses our earlier point about non participation. Dissecting that 94m we mentioned earlier, Snider breaks down those who can’t and those who can work but aren’t and arrives at 15.3m people simply missing from the labour force. One quickly understands the Trump (and the like) phenomenon of disenchanted voters.
The other takeaway from the last chart is the nexus with share valuations. Clearly in this ‘recovery’ earnings are going sideways, personal wealth for the 99% is going sideways, and yet shares have soared – all on price multiples – not on fundamentals.
It’s just math.