Strong Hands Still Stacking BTC
News
|
Posted 21/12/2021
|
8391
Bitcoin endured a second consecutive week of price ranging, following the sharp drawdown in early December. After opening at $50,093 US, the price saw a high of $50,186 and a low of $45,671, a compressed range that spanned only $4,515, with BTC closing out the week down -6.1% presenting a great opportunity for investors to top up their crypto portfolio.
Many eyes were on the Federal Reserve's comments following the Federal Open Market Committee meeting on Wednesday, and broader markets generally traded in consolidation throughout the week. Let’s have a look at BTC’s onchain data to observe the dynamics driving the crypto market…
A common behaviour when prices make new highs is for profitable coins to be spent into market strength. Holders from lower prices want to pay themselves for the effort of waiting and taking on risk, and it results in profit-taking and elevated activity from older coin cohorts.
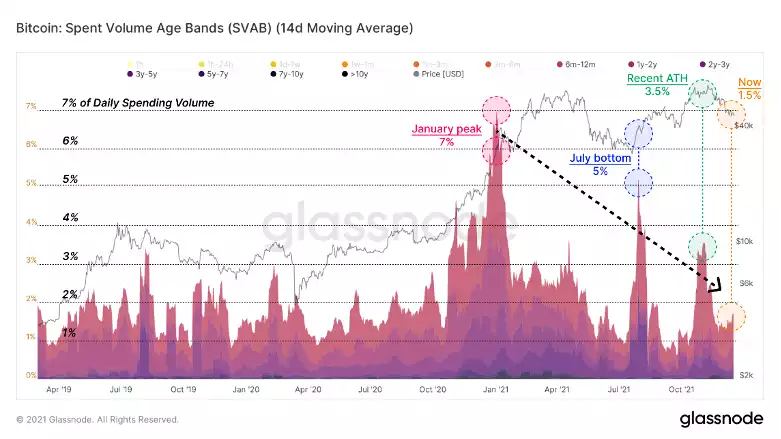
The Spent Volume Age Bands, filtered below to display spent coins older than 6-months, illustrates what older spending volume can look like. In the late 2020 bull run, >6m coin spending comprised 7% of on-chain volume. Since then, successive peaks of spending from this group have declined, topping at just 3.5% of daily volume at the recent highs.
Among the investors anticipated to take action at the recent highs were Long-Term Holders, who are consistent distributors in price discovery. The cyclical nature of Long-Term Holders is as follows:
- Steady accumulation in bearish market phases, eventually reaching a level of 'Peak HODL'.
- Spending of profitable coins at the all-time high, realising profits into market strength.
- By the time price peaks and rolls over, Long-Term Holders have begun net accumulating again.
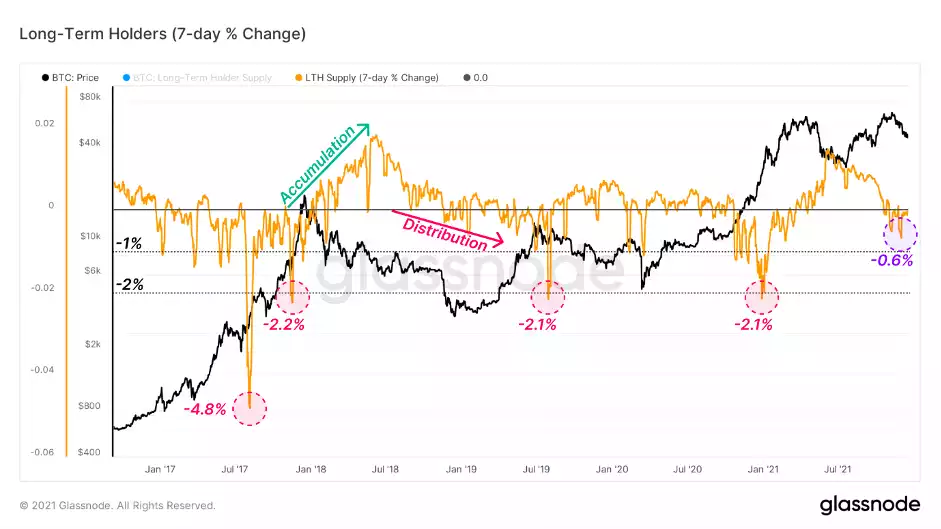
Distribution events, visualised below as the 7-day change in Long-Term Holder Supply, typically result in peaks of 2% or more supply moved to new buyers. However, the recent all-time highs and subsequent pullback have seen a peak spending rate of only 0.6%, just 30% of the expected amount from Long-Term Holders. These low time preference investors seem reticent to spend at current prices, which may speak to sophistication in their decision making.
New investors are the first group tested by price weakness. In the days following the November all-time high and beyond the liquidation flush of December 4, loss realisation on-chain of $50-$100M per day was common. For loss realisation to occur after an all-time high, those spenders must be top buyers.
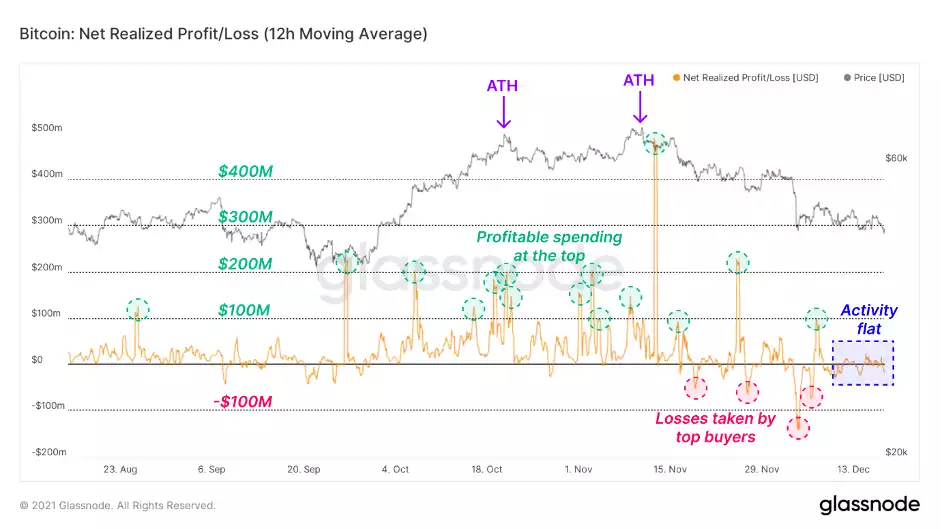
Net Realised Profit/Loss visualises the daily outcome of on-chain spending in USD terms. Observe:
- Consistent profit-taking around the all-time highs, as coins from lower prices, are spent to new buyers.
- Steep loss realisation in the days afterwards as price pulled back over -30%. Losses realised after all-time highs indicate coins purchased at the top.
- Relatively flat activity in the past two weeks, suggesting investor interest is reaching an exhaustion point at current prices.
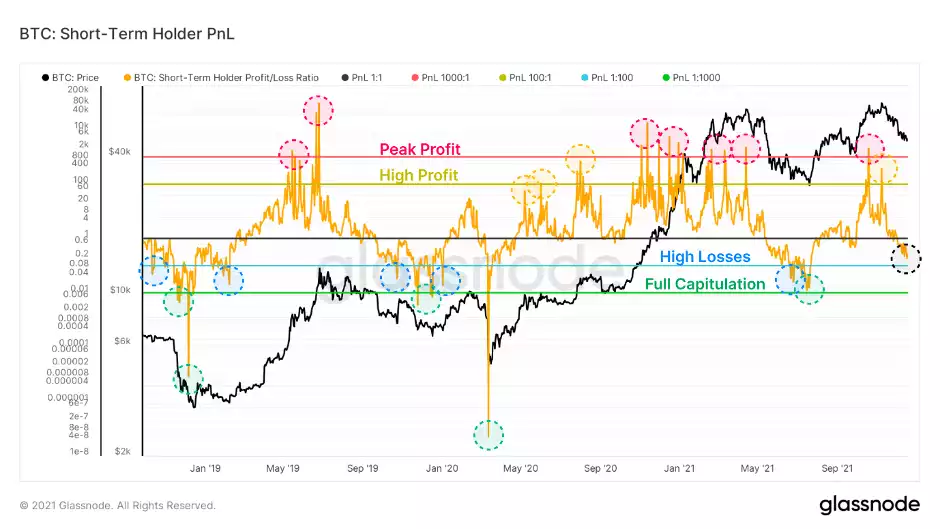
With the understanding that older coin spending is declining, and Long-Term Holders mostly on the sidelines, it can be assumed that the recent coin activity is largely contained within the Short-Term Holder cohort. A look at the standing Profit/Loss ratio of Short-Term Holders can show the health of this group's supply and illustrate periods of overheated price action.
- High values over 1000 (red) indicate moments of extreme profitability for new investors. These moments are brief and often precede local reversals.
- Values between 100-1000 (yellow) mean newer buyers are in a healthy profit.
- Values below 1 (blue) indicate Short-Term Holders in a loss.
- Low values near or below 0.1 (green) are moments of heightened vulnerability for new buyers, and frequently mark local bottoms where value is established.
Short-Term Holder PnL spiked dramatically in late October as price ripped to all-time highs. Buyers of Bitcoin from August and September suddenly found themselves up 60%+, and the market had to pull back to accommodate profit-taking.
Presently, Short-Term Holders finds themselves in aggregate loss, though the pace of decline has slowed along with the price. While these coins continue to churn among different hands, their lifespans stay young and they remain members of Short-Term Holder Supply.
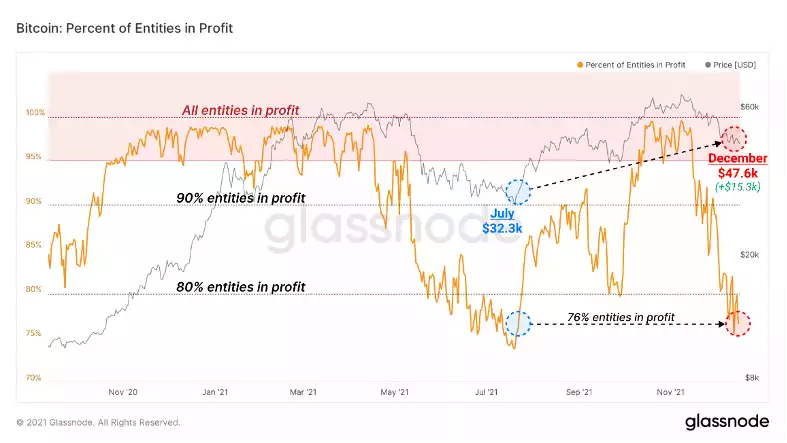
The ultimate perspective of coin rotation within the Short-Term Holder group is seen in the Percent of Entities in Profit. A remarkable observation on this chart is the arcing trend from late July to the present day:
- In late July, the price was $32.3k and 76% of all entities on-chain were in profit.
- When new highs were created in October and November, 100% of entities were in profit— an expected outcome of price discovery.
- Now in late December, the price is $47.6k (over $15k higher) and there are again only 76% of entities in profit.
For the price to be over $15k higher (+47%) than July while the same amount of investors are in profit, knowing that older spending is muted, a great shuffling of coins had to take place at the top within the Short-Term Holder group. That means they were coins mostly purchased since July, and signals that the current holder makeup is top-heavy— many coins were bought at the top and now sit underwater.
Despite Weakness, Strong Hands Continue Stacking
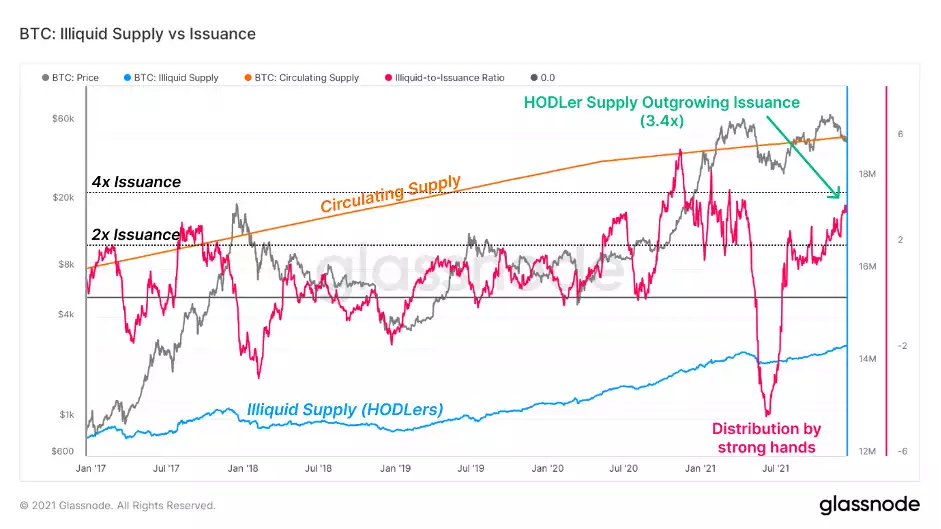
A behaviour that has left its stamp on the 2021 Bitcoin market is the constant accumulation by investors with a limited history of spending. Illiquid Supply is the amount of BTC held by on-chain entities with >=75% inflows in their history.
The supply in possession of these Illiquid entities sold off in May along with much of the market. Since that time, they have maintained a consistent pressure of accumulation, and are now taking possession of coins at a rate of 3.4x daily coin issuance.
Put another way, strong-handed HODLers are absorbing supply at more than triple the rate of new coins being mined each day.
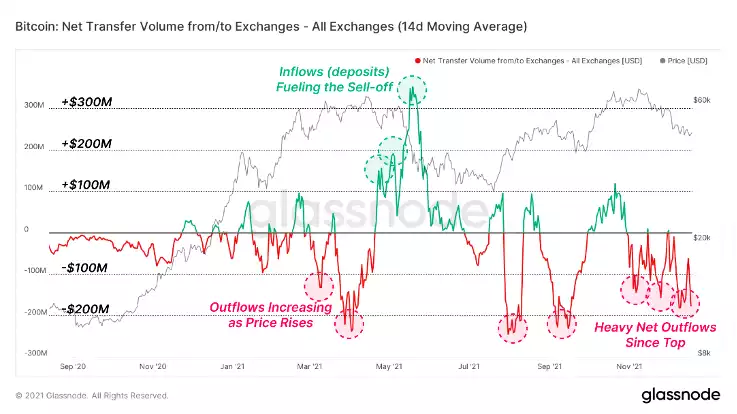
Strong hands are not the only investors pulling coins away from potential buyers. After a large impulse of deposits to exchanges in May (over $300M on a 14-day basis), Bitcoin has been steadily pulled offline into cold storage in the months following the summer lows.
The chart below shows the net transfer volume to/from all exchanges, which is the difference between all deposits and all withdrawals in USD terms. The initial all-time high break in late October saw around $100M of inflows, but the weeks following have been dominated by consistent exchange outflow volume, seeing average values of -$150M to -$175M on a 14-day basis.
Price weakness has so far not engendered a rush to the exits, as investors are instead creating friction between their ownership and the ability to sell their BTC.
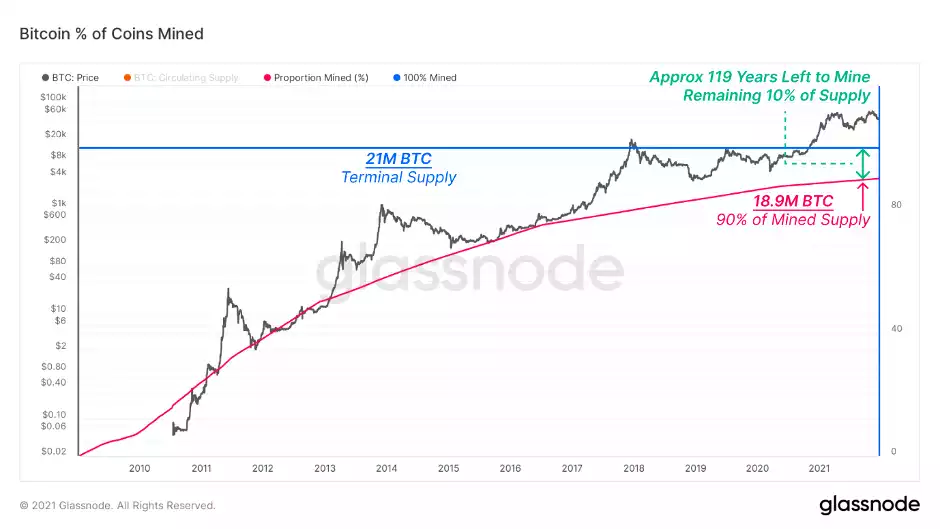
Additionally, in case you missed it, the past week saw circulating supply pass the 90% mark of its ultimate supply total, with circulating supply passing 18.9M BTC. In just under thirteen years, 9/10ths of the total BTC supply has now been issued to miners. Bitcoin's deterministic issuance schedule has much farther to go, however, with the remaining 10% of supply set to be minted over the next 119 years or so, ending somewhere near the year 2140.
With so many holder types stacking BTC for the long term, future opportunities to acquire the world's first absolutely scarce digital asset are increasingly limited.