Silver’s Next Bull Market Appears In
News
|
Posted 13/07/2020
|
21804
Today’s article is a must read. We don’t say that often. We look at the current set up for silver that looks very much like that of 1979 and 2008 from which it launched ahead of gold with 400-800% gains. Whilst gold bottomed in late 2015, it is now looking like silver’s 9 year bear market ended in March. First, the Silver Institute have just published their first half yearly interim report on demand and supply. Below is an extract from that report:
“Investment
Retail and institutional inflows into silver ETPs have been impressive this year. As of June 30, global holdings reached a fresh all-time high of 925 million ounces (Moz), which is roughly 14 months of mine supply. The ETP growth in the first half 2020 of 196 Moz comfortably surpassed the highest annual inflow of 149 Moz set in 2009. North American listed funds accounted for some 90% of the ETP inflows since March.
Retail bullion coin sales jumped by an estimated 60 percent year-on-year. Silver bar and coin sales surged in response to a deteriorating economic outlook linked to the global COVID-19 pandemic, leading to some supply-chain disruptions. This saw dealer stocks for several silver investment products quickly depleted, resulting in extended delivery lead times and higher premiums.
The recovery in professional investor activity in May and June reflected improving sentiment towards silver amongst these investors particularly as a leveraged play on gold. This trend was clearly reflected on COMEX. Although net managed money longs ended June at 176 Moz, posting a 40 percent decrease compared with end-December 2019 levels, this hides a marked improvement within the first six months, with net longs improving quite sharply between early May and end-June.
In China, improving price expectations and a rise in price volatility has also revived investor interest. Silver trading volumes on the Shanghai Futures Exchange recorded their highest monthly total for the year in May, while turnover on the Shanghai Gold Exchange remained elevated after hitting record levels in March.
Industrial and Jewelry Demand
Not surprisingly, the COVID-19 crisis negatively impacted silver fabrication demand in the opening half of the year. After a sharp contraction in the March-April period, silver industrial demand has shown signs of improvement from May onwards after many key economies gradually lifted lockdown measures. However, weak consumer confidence and a sharp rise in unemployment weighed on demand in many end-user applications such as automobiles and consumer electronics. Going forward, some of this consumer drag could be mitigated by flow through from various governments’ recently announced infrastructure investment programs, thereby lifting silver industrial demand.
Looking ahead, silver jewelry is expected to weather the storm far better than other precious metals this year. This is due to the relative affordability and greater suitability to online selling of silver jewelry. Metals Focus, the independent precious metals consultancy, forecasts an annual decline for global silver jewelry fabrication of just 7 percent against a projected 25 percent slump for gold. That has certainly been illustrated already by US import statistics, where its imports of silver jewelry (in US$ terms) have improved from -65% y/y in April to -41% in May, whereas gold jewelry imports slumped by 91% in April and have barely recovered to -81% in May.
Michael Barlerin, Director of the Silver Promotion Service (SPS), an arm of the Silver Institute focused on stimulating demand for silver jewelry in major international markets, stated, “In June, we commissioned a consumer research survey where respondents were asked to evaluate pent-up consumer demand due to the COVID 19 pandemic. The results were very positive, with 64 percent of consumers surveyed saying they were planning to purchase belated jewelry gifts and over 50 percent indicating it would be silver jewelry.”
Silver Mine Supply
Global silver mine supply is expected to continue its decline, given the temporary production stoppages of mining operations in several significant silver mining countries due to the Covid-19 outbreak. Even with most of the mining operations now back online, global silver mine production is forecast to dip by 7 percent in 2020.
Silver Price in Second Half of 2020
Investment inflows into silver are likely to continue in the second half of 2020. This is primarily a result of its safe-haven status, a widespread belief among investors that silver is undervalued in absolute terms in comparison to gold, exceptionally low interest rates (reducing the opportunity cost of carrying gold and silver), and unprecedented liquidity injections by central banks. As a result, the silver price is anticipated to surpass the US$21.00 mark in late-2020, with a fall in the gold:silver ratio to below 90.”
Whilst not in that report, below is the latest update of the total transparent holdings confirming those ETP (Exchange Traded Products such as ETFs) flows:

This coincides with a very bullish case for silver to outperform from here. Last week we wrote of hindsight in picking tops and bottoms in markets and hindsight mixed with fundamentals is starting to indicate the low we saw silver take in March on the COVID liquidity squeeze could well have marked the end of the 9 year bear market silver has endured since it’s spectacular top in 2011. Since hitting that US$11.94 low in March this year and coinciding with that record high 124:1 Gold:Silver Ratio, silver has rallied back harder than gold, up 57% and the GSR dropping to its current 96:1. Gold ended its bear run at the end of 2015 and typically silver went on to plumb lower lows as it does before it hits higher highs, it’s a well-worn history repeating story. However, if as it appears March was the end of the silver bear market the surge from here could be incredible.
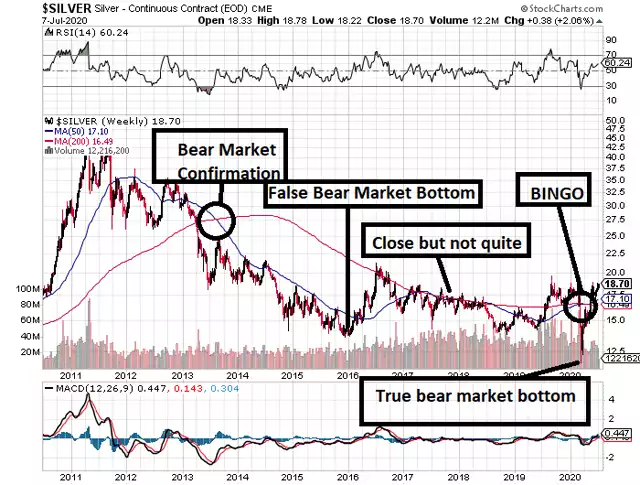
There are a number of factors indicating this could be the new bull market for silver. Firstly the 50 Weekly Moving Average (WMA) just crossed above the 200 WMA for the first time since 2003 which then marked the beginning of that epic 10x rally to that 2011 $48 top.
(chart from Austrolib)

Zooming in a bit is important as it shows the tussle silver has had forming that bottom in March and why this demonstrable breakout is potentially so important. The following chart marked up by technical analysts Austrolib tells the story:
As stated above, once silver comes off that lower low the performance compared to gold can be spectacular. The following charts illustrate the last 2 times:
From the beginning of the bull market in April 1978 silver and gold generally tracked each other until mid 1979 from which silver shot up finishing with over 900% gains, more than double gold’s 400%.
As happened in March this year, when the GFC hit and the broader liquidity squeeze played out, gold and silver, like everything else got sold off and again silver got hit much harder than gold. Up to then from 2003, gold had rallied 185% and silver 300%. After that correction, both gold and silver were both still up around 100%. And then from that bottom of October 2008, like March just gone, the two carried on in similar fashion until mid 2010 when silver went parabolic.

The timeframe really is too small to make a proper call, but here is what has happened since that 16 March low on both metals:

The other thing at play right now is unprecedented, literally all time highs, physical deliveries on COMEX in July when the month is only half way done. JP Morgan has exited their short position and has supplied an incredible 220m oz of silver into the world’s ETF’s in just a few month.
In a rare freely available report, silver COMEX analyst Ted Butler concludes as follows:
“The key is to look at the underlying mechanical aspects of what a collective covering of the concentrated short position means to the price and not the price itself. By mechanical, I mean how quickly the 8 big shorts can close out and cover a significant portion of the 70,000 contracts (350 million oz) they were short as of last Tuesday (to say nothing of the 200 million oz held short if JPM has leased the metal that has found its way into the silver ETFs). Only a small portion is capable of being covered on any given day. The good news is that future COT reports will provide the evidence (or lack thereof) of short covering as it occurs.
One reason I believe there is more of a pressure cooker analogy in silver than in gold, other than price pressure being relieved in gold as gold prices have risen much more than silver, is the dimension of the concentrated short positions in each. Over the past few months, an amount of physical gold roughly equal to the concentrated short position of the 8 largest shorts, close to 25 million oz, has been deposited into the COMEX gold warehouses. In fact, I believe the reason for the large physical inflows and large deliveries to date is related to the concentrated gold short position. Certainly, no one can claim 25 million oz of gold is impossible for the big shorts to come up with. After all, 25 million ounces of gold, while a very sizable $45 billion in dollar terms, is less than 1% of all the gold bullion in the world.
It’s different in silver, where the 350 million oz concentrated COMEX short position (to say nothing of an additional 200 million oz short position if my claims of leasing are accurate) seems to preclude that amount of physical silver being available to the big shorts. This is what separates silver from gold, namely, it is conceivable for the concentrated short position in gold to be offset by physical metal, where that would seem to be impossible in silver. The big silver shorts coming up with the equivalent amount of physical metal at close to current prices is about as likely as me discovering the vaccine for Covid-19 or becoming the new hairdresser to the stars. So, we sit and wait for the inevitable short covering and silver price explosion.”
If you wish to read his full report you can do so here.
History tells us silver can easily go 10x from here if this is indeed the bottom of that painful 9 year bear market. So many factors have led to this ‘coiled spring’ or ‘pressure cooker’ as Butler calls it. That this coincides with the macro factors we write of every day of unprecedented debasement of currencies, quite possibly a depression not just a bad recession, and equity markets in complete “irrational exuberance”, sets the scene for spectacular gains for this next silver bull run.