REPO’s back, but not as you remember it
News
|
Posted 24/05/2021
|
5853
The battle between inflation and maintaining easy monetary policy in the US is starting to show tangible signs of blowing up. As we discussed last week, the Fed are choosing a lower inflation metric to justify their easy money policy, and even the official CPI is understated having long ago removed house prices which are on fire in the US. On the other side last week saw the Fed have to drain over $350b in one day on the REPO market as banks drown in all their printed money, nearly $300b of which they ADDED on that same day….
Late last week saw smoking hot prints from the latest Markit PMI’s with manufacturing hitting an all time high 61.5 and likewise services with 70.1 and both higher than expected. Against that business confidence slid again for the 7th straight month as concerns around input costs and market tolerance of inflated prices worries them.
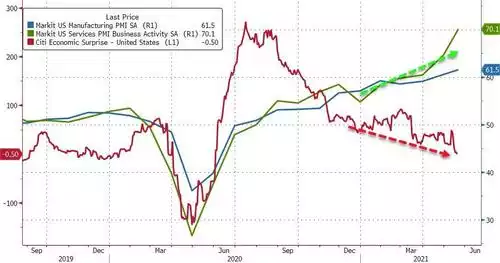
In the words of IHS Markit’s chief economist:
“The May survey also brings further concerns in relation to inflation, however, as the growth surge continued to result in ever-higher prices. Average selling prices for goods and services are both rising at unprecedented rates, which will feed through to higher consumer inflation in coming months.”
There was also a reminder of the implications of the selective CPI basket from the former chief economist of Alliance Bernstein, Joseph Carson who observed:
“Apples-to-apples, consumer price inflation nowadays is running close to the high inflation readings of the late 1970s. That should be a red flag for policymakers as monetary decisions are focused on actual outcomes, not forecasted. But reported inflation statistics do not show the 1970s inflation-style inflation because they no longer include actual house prices.
The old consumer price index included house prices in measuring the owner's housing cost, whereas the present-day price index base owners' housing cost on an arbitrary, non-market rent measure. The only way to make a price series strictly comparable over time is to use the same measurement process.
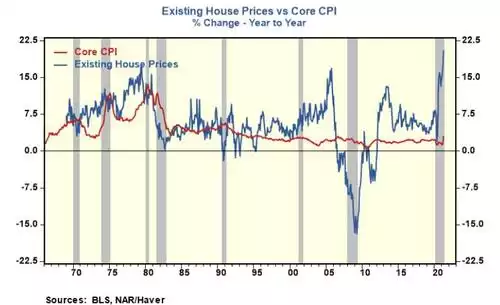
In April, the median price for existing homes increased 20.3% in the past twelve months, a new record and far above the 1970s high-reading of 17.4%. More importantly, the increase in existing house prices is ten times greater than the 2% increase in non-market rents in the consumer price index.
Owners rent index accounts for nearly one-quarter of the overall consumer price index and a full one-third of the widely followed core index. Inserting actual house prices in place of the non-market rents would add roughly five percentage points to 4.2% headline and 3% core inflation readings. The last time the US consumer price inflation ran that high was during the 1978 to 1982 time frame.” The following chart illustrates the disparity
The inflation drums are beating hard but as we have discussed many times, the Fed also knows it can’t tighten or otherwise risk rising rates on the mountain of debt behind this surge and also risk tanking financial markets hooked on their ‘gear’.
Markets though are not always within the Fed’s control as we’ve seen late last year and earlier this year with rising bond yields ignoring the ‘official’ zero interest rates, and now that bogey Jo-public doesn’t see or understand, the REPO market is raising its head again.
We saw in September 2019 and again in March 2020 the Fed step into the REPO market which we explained here in Sep 2020. That article was titled “Liquidity REPOcussions – Was that the warning sign?” and yes it was before the market tanked just a couple of weeks later as it rejected the Fed’s tightening policy resoundingly and the Fed started “notQE” in response.
But this time is different. This time the Fed has had to step in to drain liquidity not add it… $351b of it in one session… For context, compare that to march 2020 as COVID shocked markets:
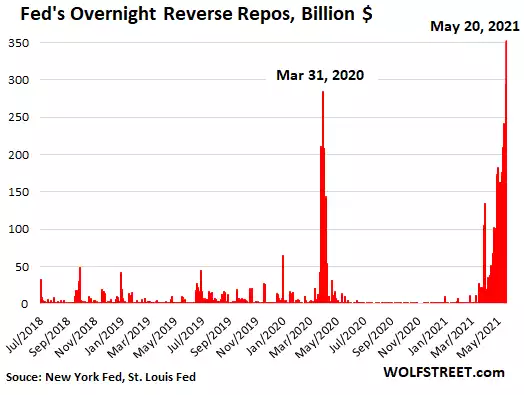
As the author of the chart, Wolf Richter explains:
“These reverse repos are a sign that the banking system is struggling to deal with the liquidity that the Fed has been injecting via its QE. And that’s in part why there is now some clamoring on Wall Street for the Fed to taper its QE purchases because the banking system is now drowning in liquidity that banks have as reserves on their balance sheet. By buying Treasuries in the repo market, the banks lower their reserves and increase their Treasury holdings.
So with one hand, as part of QE, the Fed is buying $120 billion a month in Treasury securities and MBS. With the other hand, the Fed took back $351 billion via overnight reverse repos, undoing nearly three months of QE.
It’s the kind of crazy situation that you run into when you push something to the extreme, as the Fed has done with its asset purchases, and you get all kinds of side effects.”
And so here we are again. The Fed has injected so much free money into the system that inflation now appears to be almost definitely heading towards being out of control and even banks can’t deal with it. The Fed acknowledged the conundrum in their last minutes:
“A number of participants suggested that if the economy continued to make rapid progress toward the Committee’s goals, it might be appropriate at some point in upcoming meetings to begin discussing a plan for adjusting the pace of asset purchases.”
And the paradox:
“Regarding asset valuations, several participants noted that risk appetite in capital markets was elevated, as equity valuations had risen further, IPO activity remained high, and risk spreads on corporate bonds were at the bottom of their historical distribution.”
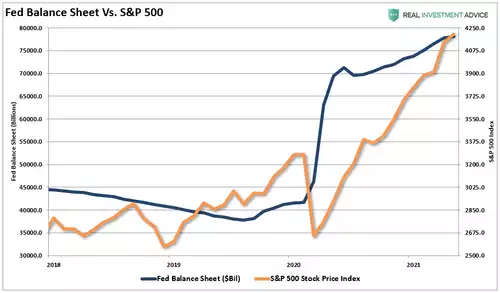
As a reminder of the correlation between the US sharemarket and the Fed’s monetary expansion we will leave you with Exhibit A below. This cannot end well…