Record QE – One Chart Shows The Result
News
|
Posted 29/07/2016
|
6413
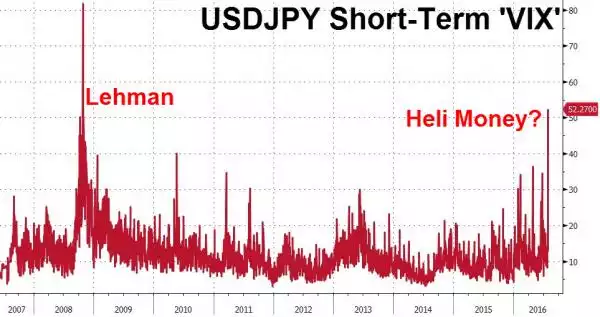
Any observer of markets whilst most of us slept last night would have seen a market on edge before the Bank of Japan meeting outcomes later today. If ever you wanted to ‘observe’ a market hooked on stimulus this was your chance. The prospect of ‘helicopter money’ is upon us… The first chart below illustrates the level of volatility in the US dollar / Japanese Yen pair – it’s highest since the Lehman collapse of the GFC.
Japan is the world’s 3rd biggest economy, or 4th if you count the EU as one. They have battled deflation for over 2 decades and unleashed, per head of population, the world’s most aggressive monetary stimulus program from 2011. The definition of stupid is often quoted as doing the same failing thing over and over and expecting a different result (aptly illustrated in the Simpson’s - “is my brother dumber than a hampster”). Japan’s economy has not only not improved, on most measures it is worse. But they do have a “world’s highest” debt to GDP ratio of 400% to show for it…. So hard have they gone, that they are now within a whisker, and save for QE4 on track to exceed, the balance sheet (accumulated debt to print money) of the US Fed at over $4trillion!
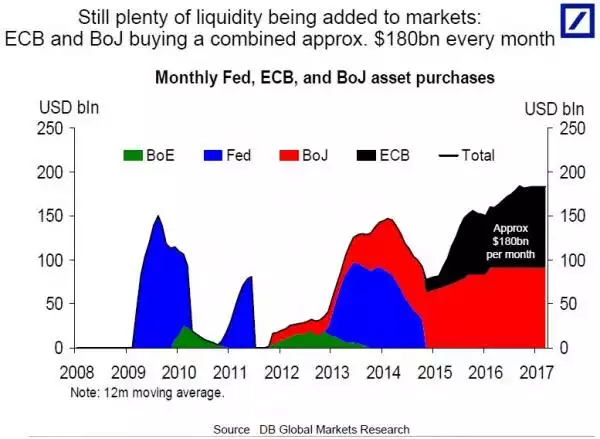
But (as you can see below) they are not alone as the European Central Bank (ECB) has joined the money printing party with gusto, to the point where combined we are now seeing an all time record high global Quantitative Easing (QE = money printed) program of $180billion/month, in excess of even the US Fed’s attempts post GFC.
What makes this all the more remarkable is we have nearly 80% of economists predicting BoJ will increase theirs further tonight, Bank of England’s (BoE) Mark Carney flagging they could likely do so next meeting, and ECB’s Mario Draghi suggesting the same for them.
If you want just one simple illustration to take away today please study the following chart. What it show’s in simple terms is a direct correlation between global share prices (MSCI) and global monetary stimulus (via global central bank balance sheets) and NOT the very company earnings projections that should be underlying these share prices.
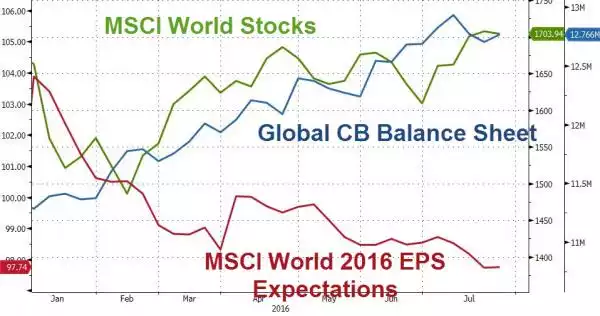
This is NOT a real market, this is a market supported by debt accumulating cheap money. This can only end one way… Is it any wonder the smart money is pouring into gold and silver…