Post QE Reality
News
|
Posted 21/08/2015
|
4572
Wall Street had a shocker this week down another 1.6% last night, Euro shares were down 2.2% last night and China’s down 3.4%. Gold and silver continued to rise. It’s like reality is hitting….
The artificial nature of the post GFC US sharemarket is best expressed in the charts below.
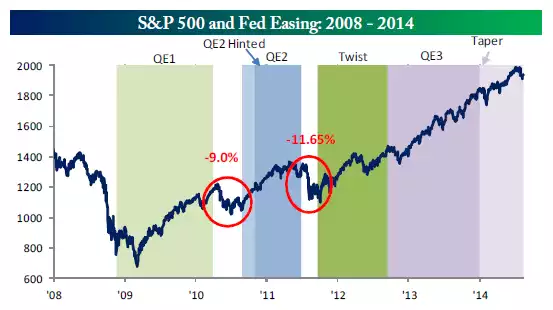
Firstly let’s look at the S&P500 since the GFC. Note each previous time QE (money printing) stopped, down came shares. They were a bit more careful after QE3 in their continuation of zero interest rates and ‘nearly there’ speak as exemplified by the FOMC minutes this week.
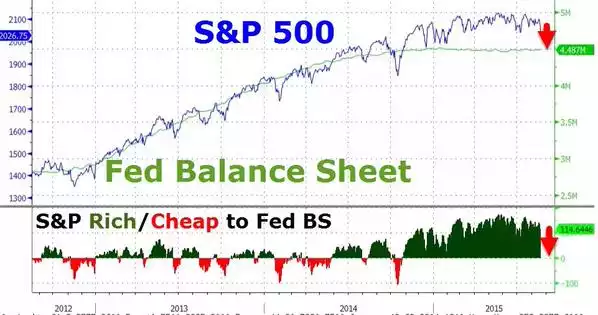
In a slightly different way – relook at it in terms of the correlation with the US Fed’s balance sheet (illustrating the debt it has taken on to print the money through its QE program that bought the shares). Note the S&P500 is starting to head down as reality hits.
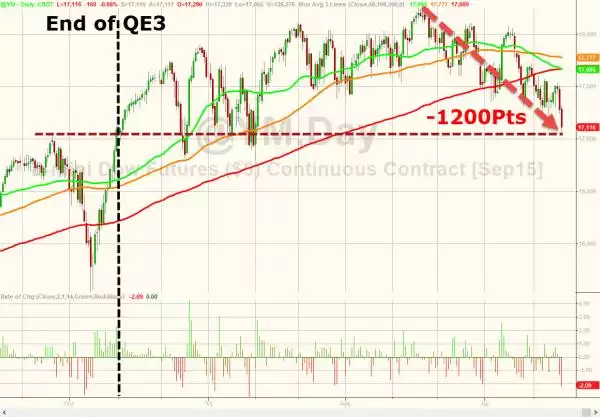
Now look at the Dow Jones and it’s already there….
As we reported earlier on the trade volume (LOLume) one could get the sense that reality is starting to hit home…