Onchain Data Suggests More Gains for Crypto
News
|
Posted 09/11/2021
|
5520
Bitcoin has had a remarkably strong week, consolidating between $59,743 US and $64,242, holding onto almost all of October’s gains. As the Bitcoin price coils into what appears to be a very tight bull flag, the onchain market continues to show strength in supply dynamics, whilst onchain activity remains well below bull market highs.
The market's strength is demonstrated by a variety of onchain metrics...
Long-Term Holders have distributed a very small fraction of their holdings, as is typical in all prior cycles. However, despite hovering just below ATHs, onchain activity remains only marginally above bear market levels - meaning that there's a lot of room to move to the upside. Additionally, exchange balances continue to drain, and miner hash rate and USD revenue are approaching new highs.
This combination of robust supply dynamics, mining network recovery, and relatively low network activity points to a fairly constructive outlook for Bitcoin over the coming weeks - which will naturally drag the rest of the market up with it.
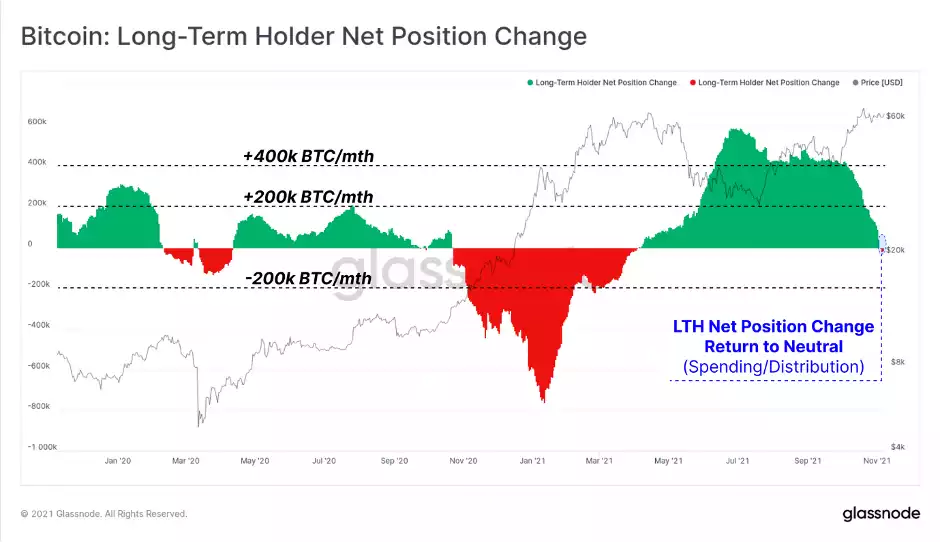
Onchain spending behaviour has slowed down the Long-term Holder Net Position change metric, which has been in a large accumulation period since April this year. The rate of LTH accumulation reached over 400k BTC per month for around 5-months through to late September and has now returned to a neutral level. This indicates that over the last 30-days, LTH supply is flat on the net, and an equivalent volume of coins are maturing into LTH status, as are being spent out of it.
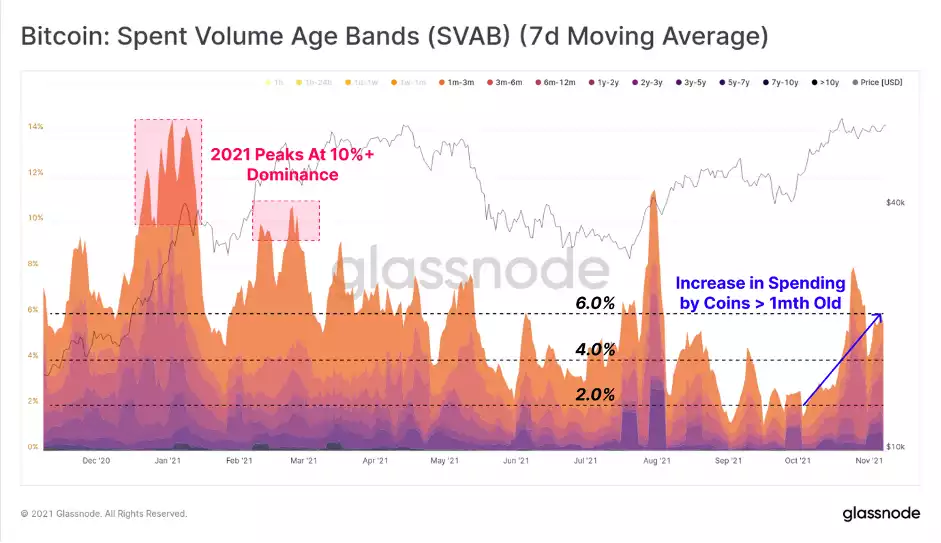
We can see similar spending behaviour in the Spent Volume Age Bands, where the dominance of coins older than 1-month has risen to 6% of total onchain volume. Note however that levels of 6% were commonplace throughout much of 2021, and especially in Q1 where it reached over 10% as the bull market powered higher.
This metric highlights that whilst older coins are increasingly on the move, the market appears to be absorbing the sell-side without issue. Note also that bull markets can often sustain this elevated sell-side pressure for some time before topping out. When the LTH selling pressure eases, the BTC price will be released and able to go into a substantial price discovery phase.
Demand dynamics in a bull market tend to come in two phases:
- Smart money accumulation (pre-ATH), where on-chain activity is low, supply dynamics remain constructive, and most spending looks like strategic profits are being taken.
- Hype and euphoria (post-ATH), as media coverage of the asset increases, retail trader interest rises, and on-chain activity starts to climb. Older, more experienced hands generally increase their distribution from this point onwards.
Both the sell-side supply dynamics described above and the demand dynamics that follow, both speak strongly to current market characteristics still being of the first phase: smart money accumulation, albeit closer to the transition out of this phase.
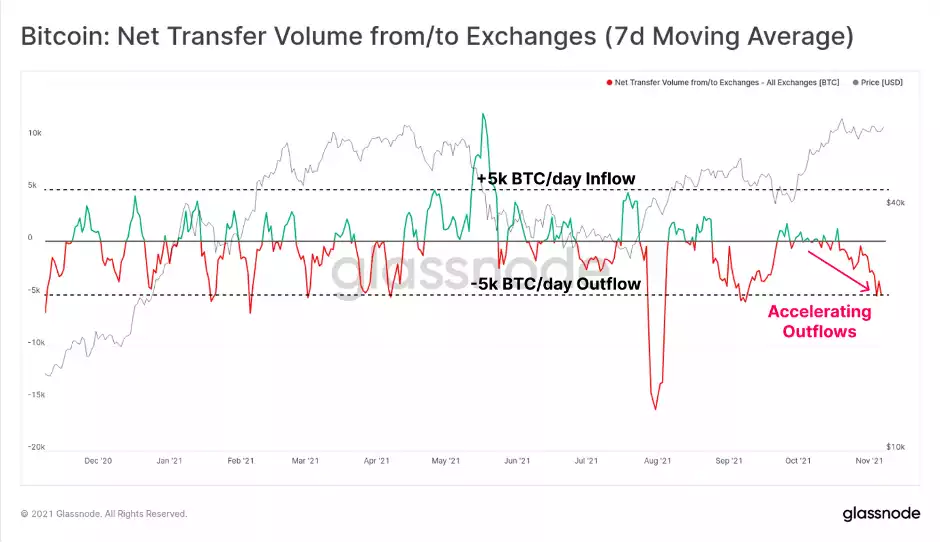
The first evidence of this is exchange net flows, which continue to demonstrate a remarkable dominance of outflows. Outflows have accelerated this week, reaching over 5k BTC in net withdrawals daily.
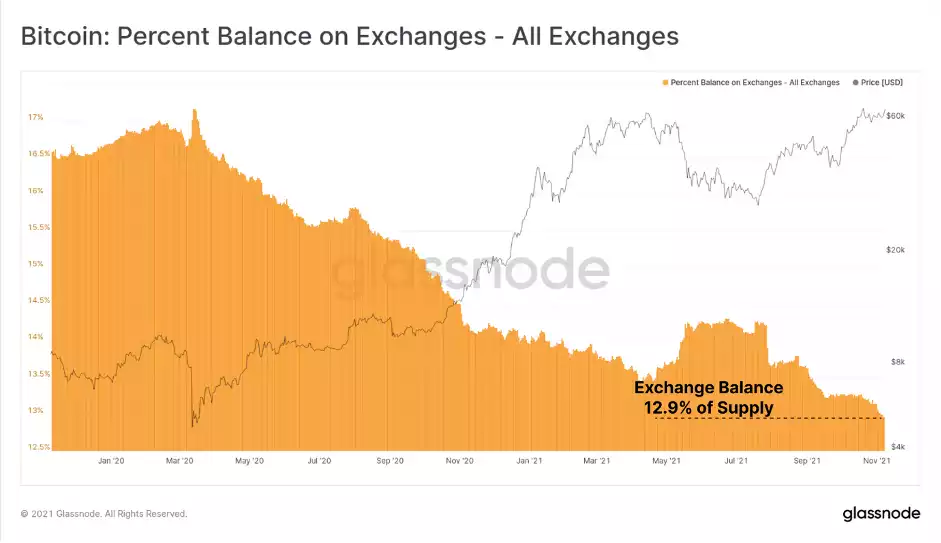
As a result of continued exchange outflows, the aggregate BTC exchange balance has fallen to multi-year lows of 12.9% of circulating supply. Even as Bitcoin consolidates below ATHs, exchange reserves continue to lessen.
So, it looks like everything is aligning for a few big weeks in the crypto world. Perspective was offered by crypto analyst 'TechDev', who posted the following chart comparing the price action during previous Bitcoin bull cycles to the current market.
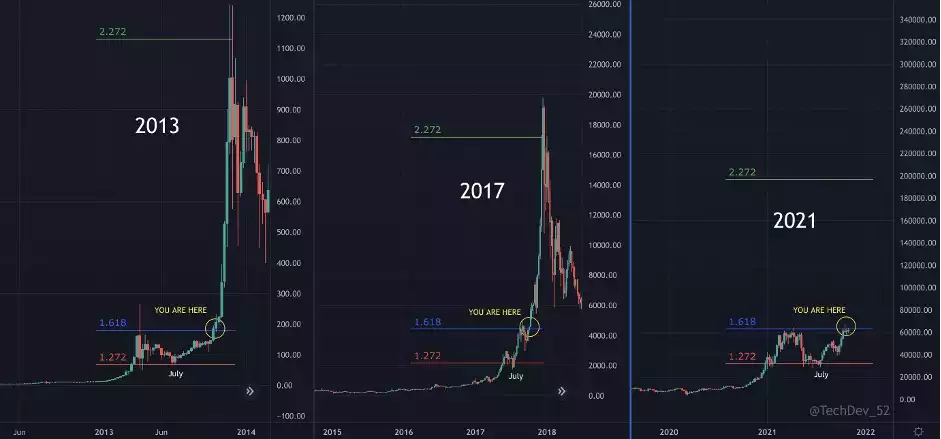
TechDev suggests the possibility that a parabolic blow-off-top could come within the next couple of months for Bitcoin if the current cycle plays out similarly to the last two…