Lowest Rates in 5000 Years, and More…
News
|
Posted 25/08/2016
|
5437
We report occasionally when the ‘big money’ make public calls on gold or shares. Every quarter the US requires hedge funds to release their 13F which outlines their market positions. That has just come and gone and we wrote an extensive piece on Friday on this (it’s a must read if you missed it). In that article we reported Carl Icahn, one of the world’s 50 richest, is now an incredible 149% net short the US sharemarket. Jeff Gundlach ($100b Doubleline Capital) is 100% net short too. No one else is close to that but we saw George Soros double his short ‘Put’ exposure to the S&P500 to $839m in his $4.7b fund and then Paul Tudor Jones (head of the (also) $4.7b Tudor Investment Corp) nearly quadrupled his S&P500 puts to $1.7b. For those new to markets (from Wikipedia) “- a put or put option is a stock market device which gives the owner of the put the right, but not the obligation, to sell an asset (the underlying), at a specified price (the strike), by a predetermined date (the expiry or maturity) to a given party (the seller of the put).” In other words it is a bet on the market dropping. Now keep in mind these disclosures were as of 30 June and the market really kicked up after that date to even greater highs against the backdrop of more declining earnings. So whilst they look superficially to have made the wrong call these guys are seeing the bigger picture and you could well expect a further increase in their put options since. The smart ones don’t get caught up in the hype, they look at sentiment as contrarians and the bigger picture.
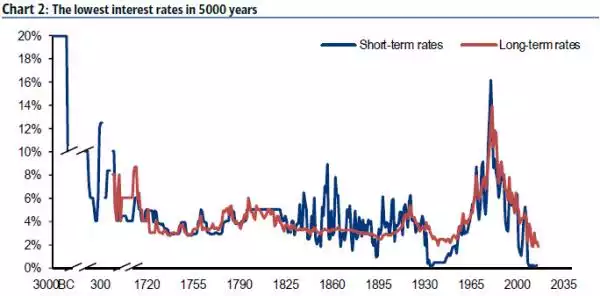
A common theme from these guys is that this ‘unprecedented’ world of zero and negative interest rates, negative yielding bonds and the associated inflation of asset bubbles is going to end badly. It is interesting to look at just how unprecedented this really is. Back in June BofA Merrill Lynch had a look back, way back and discovered we haven’t seen global interest rates this low in 5000 years!
It doesn’t end there either. Try the following on for size:
“lowest UK base rate since 1705; a negative Japanese bond yield for the 1st time since 1870; all-time highs in corporate bond returns; slowest Chinese nominal growth in over 20 years; US stocks at 60-year highs vs Europe; bank stocks at 75-year relative lows; largest losses from commodities since 1933.” We are also in the 2nd longest bull market run in US shares in all of history.
And that dear reader was back in June. Since then those US shares have gone higher to all time records, there are over $13.4 trillion in negative yielding bonds not just Japan but across Europe as well (in June it was ‘only’ $9.9t), and at that time there had ‘only’ been 654 rate cuts since the GFC (we’ve now passed 668).
Over that 5000 years Fiat currencies have come and gone, Reserve Currency status changed hands many times, and Kingdoms built and destroyed. There have been two monetary constants in all that time, two assets that have preserved value… gold and silver.
But it’s probably different this time, huh….