Just like before ’87 – But worse
News
|
Posted 02/03/2018
|
8263
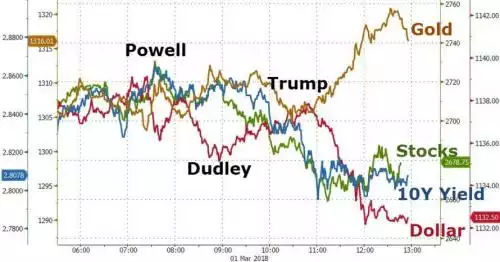
Last night saw more losses on Wall St, the Dow Jones down 420 points or 1.7% and the USD resuming its fall, down 0.5%, whilst gold and silver saw gains. The reasons were more comments from Fed officials, Powell and Dudley, with the latter decidedly hawkish (see more rate hikes this year) and then of course the news that’s across headlines this morning of Trump’s surprise trade war salvo of 25% tariffs on steel and aluminium. The end result is Wall St in the red for 2018, joining Australia’s sharemarket which is already down 1.5% before the inevitable sell off today. Gold is up 2% YTD.
Whilst most talk of the fear in markets over the Fed hikes is about the interest burden of all that debt, there is a more fundamental consequence (and indeed the actual reason for implementation) and that is Money Supply. There are various forms often quoted (M1, M2, M3) but today we will focus on M2 which is also closest related to the Austrian Economics measure of TMS or True Money Supply. Essentially, as the Fed (or any central bank for that matter) tightens monetary policy the supply of TMS reduces. What we have at the moment with the US Fed is the double whammy of hiking rates but also unwinding their massive QE instigated pile of bonds sitting on their balance sheet, some $4.5 trillion. So far that has been just $10b per month, now $20b per month and rising to $50b throughout this year to meet their stated objective of selling $450b by year’s end. Since they became clearly more serious about tightening the TMS has plummeted, per the following graph (courtesy of realforecasts.com):
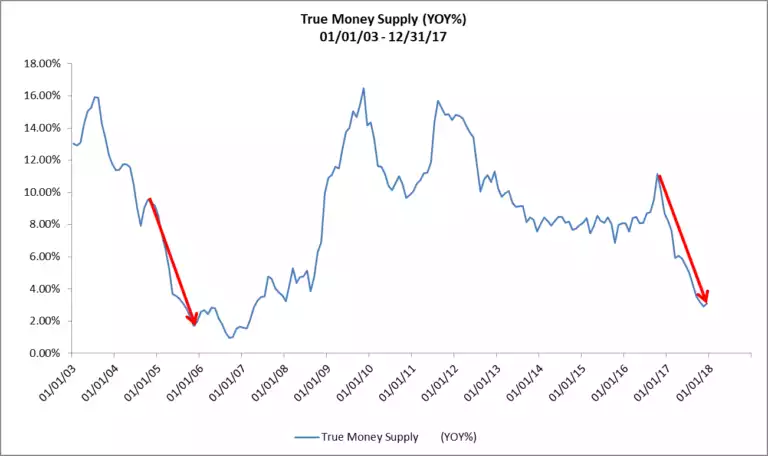
What the graph above also highlights is what can, and per the graph below, usually happens, is a market correction shortly after and often a recession as well.
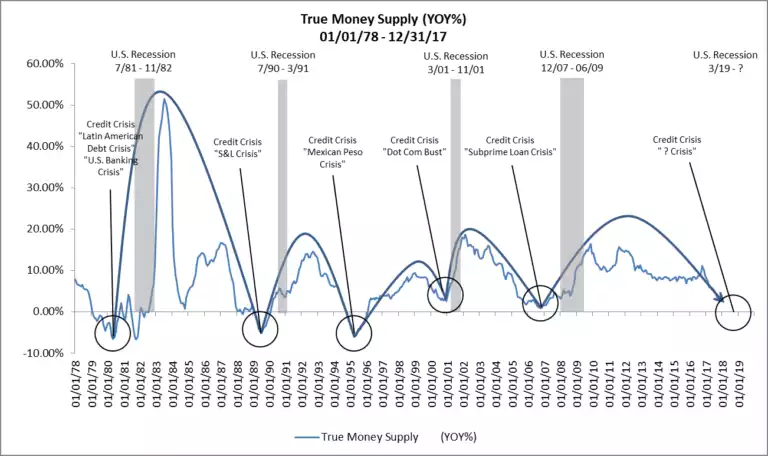
From realforecasts.com in reference to the above chart:
“Note that in each TMS expansion and contraction cycle, the Fed maintained a tight policy stance until a credit and liquidity crisis occurred. Also, an economic recession typically occurred shortly after the credit and liquidity crisis. Finally, of particular note is the length of the loose policy stance in the current cycle and, until recently, the slow pace of tightening since the end of QE…..Based upon the current trajectory of this trend, and the Fed’s current policy stance, it looks like the next credit and liquidity crisis could occur during the second half of 2018, with an economic recession and real estate market downturn to follow.”
One such similar pattern to today was that experienced before the 1987 crash. Coincidentally today’s Australian Financial Review ran the article titled “Analyst points to 'uncanny resemblance' between today's market and 1987”. Here it is, and it’s worth a read….
“Analysts have been left scrambling to find a plausible explanation for the vicious sell-off in late trading on the US stock exchange on Wednesday night [clearly to print before last night’s falls], that left the blue-chip Dow Jones Industrial Average down 1.5 per cent, while the S&P 500 tumbled 1.1 per cent.
For weeks, analysts have been pointing out that US share and bond prices are now moving in tandem. But this correlation broke down overnight, as bond prices climbed – which pushed the yield on benchmark 10-year US bonds down to 2.87 per cent – while share prices tumbled. (Yields fall as bond prices rise.)
But one analyst who would not be surprised at all by the savagery of the sell-off is Russell Napier, an independent strategist and co-founder of investment research platform ERIC. He's long been arguing that the rapid tightening in US monetary conditions is simply not compatible with robust economic activity, stronger inflation and rising asset prices.
In his latest note, Napier says, "in the US, M2 [which measures the amount of cash and liquid assets, such as saving accounts] is growing at just 4.2 per cent year on year, one of the lowest post-World War Two levels, while US bank credit growth was growing at just 1.9 per cent year on year in January. Growth continues to slow, and for the first six weeks of this year, it was growing at an annualised rate of just 0.7 per cent".
According to Napier, this is happening because rising US interest rates have crimped demand for bank credit, which is destroying the commercial banks' ability to create money.
And he expects that the US central bank's decision to raise interest rates in December will "likely lead to a further decline in bank credit growth and hence money growth".
M2 growth
This means there is now "an uncanny resemblance" with 1987, he points out.
In early October 1987, the Nobel prize-winning US economist Milton Friedman pointed to the slowdown in M2 growth from about 8 per cent year on year in 1986 to about 2.5 to 3 per cent, and warned that the odds of a recession in 1988 were "very high indeed".
Napier argues that Friedman, who died in 2006, turned out to be wrong about the economic consequences of the slowdown in the growth of money supply, possibly because he didn't anticipate that Alan Greenspan, who was then running the Fed, would slash interest rates after the October 1987 sharemarket crash.
"But on some things Friedman is right – it is difficult to see how a very low rate of M2 growth is compatible with growing real economic activity, rising inflation and also rising asset prices."
Another glaring similarity is the rise in US bond yields. Bond yields climbed from 7 per cent to 8.5 per cent in 1987, before briefly spiking to 10.1 per cent just before the October crash.
So far, the rise in US bonds has been much more modest. Over the past 18 months, the yield on benchmark 10-year bonds has risen from a record low of 1.4 per cent in July 2016 to about 2.9 per cent at present. Still, as Napier notes, "the percentage rise in yields has been much larger than in 1987".
High debt levels
What's more, he says, "we do also need to remember that credit to the US non-financial private sector was 121 per cent of GDP in 1987 and it is 151 per cent today. US total public debt was 48 per cent of GDP in 1987 and today stands at 104 per cent of GDP.
"With debt levels this high, smaller absolute movements in interest rates will likely have bigger impacts than they had in 1987."
Of course, there are some significant discrepancies between the present situation and 1987. But, according to Napier, "these differences don't seem to make a sudden decline in equities less likely, but actually more likely".
Three decades ago, the US savings rate was 8.9 per cent; now it has fallen to just 2.6 per cent, very close to a record low.
And in 1987, the US budget deficit was shrinking. Now, the non-partisan Congressional Budget Office is forecasting that the US budget deficit will balloon from $US666 billion ($860 billion) in the 2017 fiscal year to $US975 billion in the 2019 fiscal year.
"Time will tell how far US interest rates have to rise to fund the larger US fiscal deficits at a time of a near record-low savings rate," Napier comments.
Another major difference is that the US central bank was not selling bonds in 1987. This year, however, the US Federal Reserve plans to sell about $US228 billion of government bonds as part of a carefully worked out plan to shrink its bloated balance sheet.
The contrasts between the present situation and 1987, Napier says, means "it is very difficult to see how equity prices would not be in the line of fire as the monetary slowdown continues.””