Is the Crash Imminent?
News
|
Posted 10/02/2016
|
5432
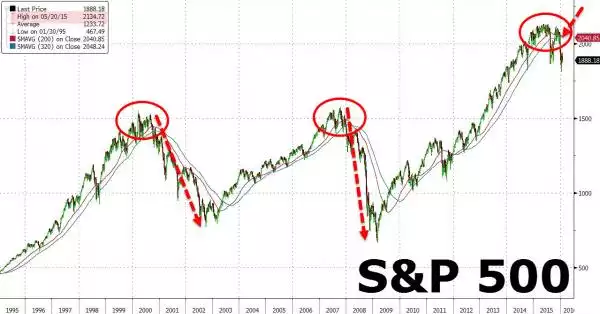
The US sharemarket, and indeed most around the world, is solidly down this year. After last night it is now 9.4% down in just 5 weeks. Our own All Ords is down 8.3% (whereas gold is up 15.7% and silver 13.5% as we write). That’s a fair correction and has some suggesting now is a good buy – ‘buy the dip’ as they say. But let’s step back a little for some perspective. The chart (albeit a few days old) below is the S&P500 in the US encompassing the last 2 crashes of 2000/1 and the GFC. In terms of the technical set up it’s just smashed through both the 200 and 320 day moving averages. That is a precarious situation at a time when there are the looming issues of Chinese currency devaluation, Euro bank impairments, and ‘energy sub prime’ defaults to name a few. What the perspective allows too is that -9.4% may seem bad now, but it may merely be the beginning of potentially the biggest crash in history. Unless of course ‘this time is different’…
French banking giant Societe Generale’s Albert Edwards had this to say about the chart below (initially referring to his formative time at Bank of America):
“I remember the head of fixed income explaining to me it was far better not to try and pick market tops or bottoms but to wait and observe the market turn, making the trade late rather than prematurely trying to pick the bottom or top.
So the chart below is notable, showing that key 200d and 320d moving averages for the S&P have just been breached to the downside. If one is looking for key technical indicators to ring the bell on the cyclical bull market- maybe it has just rung loud and clear.
A renminbi [Chinese yuan] devaluation will only sever an already badly frayed safety rope.”
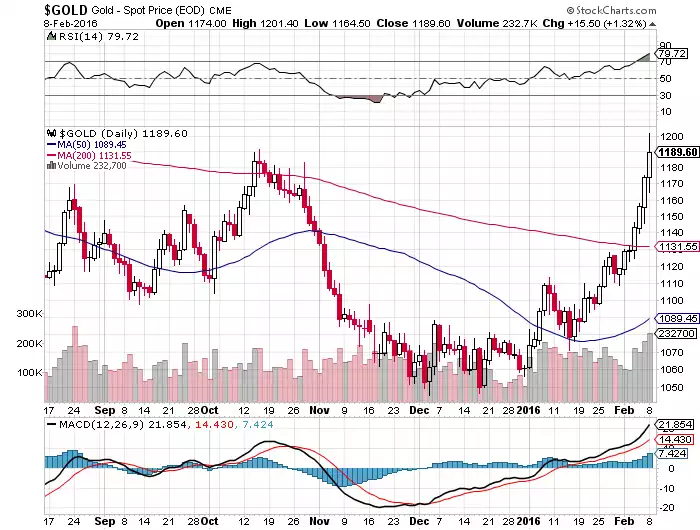
For contrast, here is the (more zoomed in) technical chart for gold. So in summary, one is looking like breaking down and one breaking up.