Will BTC Break Historic On-Chain Rules?
News
|
Posted 28/06/2022
|
7363
Almost all macro indicators for Bitcoin are at all-time lows, signalling potential floor formation. Many are even trading at levels with single-digit percentage points of prior history at similar levels. So, it begs the question, is this the bottom?
Well, it’s tricky.
After a volatile and challenging month in June, Bitcoin prices have started to consolidate around the last cycle $20k ATH level, giving investors a moment to pause and reflect. Prices traded higher this week, coming off a low of $18,067, and rallying to a high of $21,783.
The digital assets market has recently experienced a widespread deleveraging event, which has driven many valuations to lows considered extreme, in both a historical and statistical context.
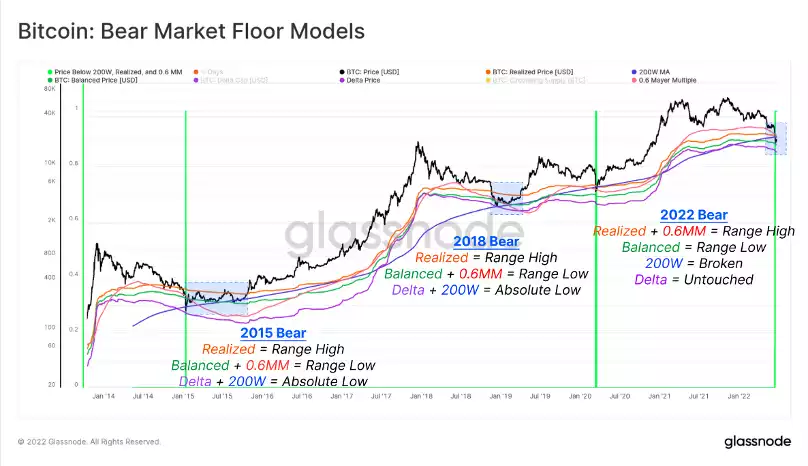
Over the past decade, several models have been developed, from both technical and on-chain foundations, in an attempt to find the lows of Bitcoin bear markets.
In the current market, spot prices ($21,300) are trading below the Realized Price, the 0.6 Mayer Multiple band, and the 200 Week MA, and recently broke below the Balanced Price during the 18-June flush out to $17,600.
Only 13 out of 4,360 trading days (0.2%) have ever seen similar circumstances, occurring in just two prior events, Jan 2015 and March 2020. These points are marked in green on the chart below.
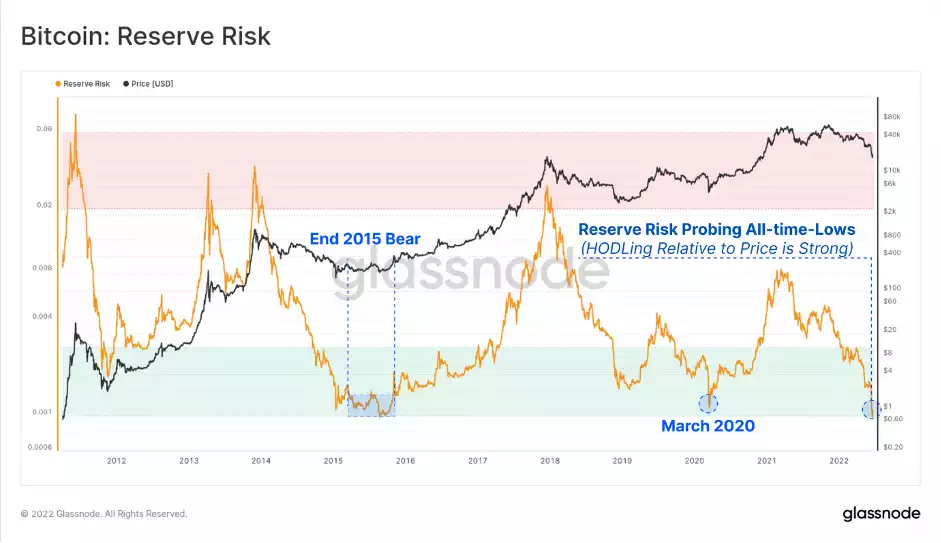
Another indicator, Reserve Risk, has also plunged to all-time-lows. This metric is heavily weighed down when there is an excess of HODLing behaviour and Coinday Accumulation within the supply. This indicates that despite the serious downside price action of 2022, Bitcoin investors in aggregate remain generally steadfast in holding onto their coins (for better or worse).
Such deep lows on this metric are coincident only with the late 2015 bear, and the March 2020 flash crash events.
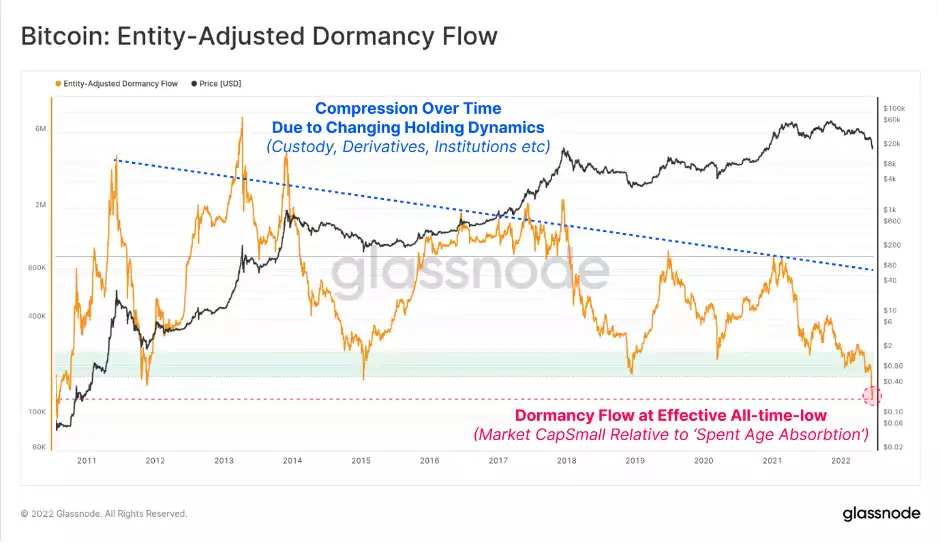
Similarly, Dormancy Flow has hit what is effectively an all-time-low, discounting pre-2011 early data. Where Reserve Risk captures the accumulation of Coindays (HODLing behaviour), Dormancy Flow weighs the Market Cap against coinday destruction (HODLers spending).
This metric is signalling that the Bitcoin Market cap is now very low relative to the value of Coinday destruction. In other words, the asset is trading below the implied fair value given the value that HODLers are liquidating. This is generally the case when the oldest coins that are being spent, are from the current cycle (i.e. old, but not ancient).
A bearish interpretation here could be that we are seeing a period of historically low demand, that is simply incapable of absorbing the distributed supply by investors. The more bullish interpretation is that the market has over-extended to the downside, and is mispriced relative to the conviction in the holder base.
Within the current macroeconomic framework, all models and historical precedents are likely to be put to the test. Based on the current positioning of Bitcoin prices relative to historical floor models, the market is already at an extremely improbable level, with only 0.2% of trading days being in similar circumstances.
Long-Term Holders have experienced a long-overdue, but seemingly classic capitulation in June, driven chiefly by 2020-21 cycle investors. Almost all macro indicators for Bitcoin, ranging from technical, to on-chain are at all-time lows – aligning with bear market floor formation in previous cycles. Many are trading at levels with just single-digit percentage points of prior history at similar levels.
We’re either at the low or we’re rewriting the rules for analysing BTC as a network.