Has Aussie Property Just Topped?
News
|
Posted 06/08/2021
|
7818
As we write this article Australia now has around 16m people in lockdown with Victoria starting its 6th and Queensland, or the populous south east corner at least, looking very unlikely to be ‘freed’ on Sunday night. NSW just seems to get worse each day. The growing view that this will be here until summer is looking less and less like a ‘worst case’ scenario.
Seemingly absent from mainstream discourse is the economic impact of this beyond the poor small business owner story. There is potentially some discounting of the impact given the speed of the ‘recovery’ last time and maybe a belief we will just ‘bounce’ out of this as well. That would appear to be a dangerous view as the circumstances now compared to last March could not be more different.
One form of comfort that we are ‘bullet proof’ is of course our housing boom. No one seems to be doing the math that this boom has happened at a time of zero immigration, aggressive government grants, accommodative lending, and suppressed near zero interest rates. No one also seems to be talking about the impacts of the incredible inflation of building costs and how that plays out. There are credentialled reports that 2 of Australia’s largest home builders are offering substantial amounts of money to current contracts to ‘walk away’ as the builders are already under water on the signed contract. Already we are seeing the impacts of the lockdowns and COVID hangover with payroll data rolling over heavily in Australia.

On Tuesday the RBA left rates as is but tapered our QE program in a clear ‘everything is fine’ jawboning attempt. Many analysts put this in the ‘brave’ category and the recent data would support that given the speed with which this wave of lockdowns is engulfing the country.
A large contributor to the feeling of comfort is our property market and the wealth effects such value rises impart to its owners. The same is happening in the US. From CNN Business earlier this week:
“A surge in credit card spending and home purchases caused US household debt to increase by $313 billion, or 2.1%, in the second quarter, according to the Federal Reserve Bank of New York.
That's the largest nominal jump since 2007 and the biggest percentage increase in seven and a half years.
In total, American consumers held $14.96 trillion in debt at the end of June — the biggest pile of bills on record and $812 billion more than what was owed at the end of 2019, before the pandemic hit.
Credit card balances rose by $17 billion in the second quarter, but they still remain $140 billion below levels at the end of 2019. Auto loan balances increased by $33 billion.
Mortgage debt, the single biggest contributor to overall household debt, rose $282 billion to $10.44 trillion. A whopping 44% of the outstanding balances were originated over the past year, accounting for both new mortgages and refinancings.”
Below is an article from news.com.au but penned by MacroBusiness Chief Economist Leith van Onselen outlining the predicament before Aussie housing. Like the US we have piled into it on the basis of low interest rates and government support. The article then goes on to point out that some of that ‘easy money’ is about to get, well, less easy. The same is the case for the US with more from that CNN piece:
“But even though the US housing market is red hot and borrowing to purchase homes is through the roof, "there are still 2 million borrowers in mortgage forbearance who are vulnerable to financial distress once the forbearance programs come to an end," said Joelle Scally administrator of the Center of Microeconomic Data at the New York Fed.
As the programs were first being implemented, the mix of borrowers taking advantage of mortgage forbearance protections was diverse in terms of credit scores. But over time, higher credit score borrowers left the programs, leaving only the more financially vulnerable.
What will happen after the pandemic-era protections expire? That's perhaps the biggest public policy question of the recovery.
Federal programs as well as lender initiatives kept loan delinquencies in check as the number of mortgages entering delinquency hit a record low in Q2.”
The take away from the article below and the US example, is that as support is removed and non RBA restrictions put in place to stop the bubble, there is a distinct impression, as with shares right now, of any entry into this market right now potentially being a FOMO top buying move. As we have written at length over this week, precious metals on the other hand are just emerging out of what looks to have been a mid bull cycle correction. Intuitively that makes sense as owning precious metals is protection from the impacts of the same monetary stimulus fueled largesse that fuels both shares and property bubbles right now.
From MB’s van Onselen:
“Australian house prices to fizzle as property market loses steam
There are two strong indicators used to predict house price growth – and both of them are showing a downward trajectory right now.
This week, CoreLogic recorded another strong 1.6 per cent rise in Australian property prices in July, with values up a remarkable 14.1 per cent over the first seven months of 2021 and 16.1 per cent over the past year.
This marked the strongest annual price growth recorded by CoreLogic in 17 years. It is also one of the broadest property booms on record with every capital city and state region recording annual growth.
There are several factors behind the strong price growth. Record low mortgage rates and an acute shortage of homes for sale has created ‘FOMO’ [fear of missing out] in the market. Household finances are in rude shape after they banked $200 billion worth of coronavirus stimulus. Finally, jobs are plentiful with the number of job vacancies per unemployed and underemployed Australian tracking at a record low.
However, while property price growth remains strong, the market is beginning to lose steam.
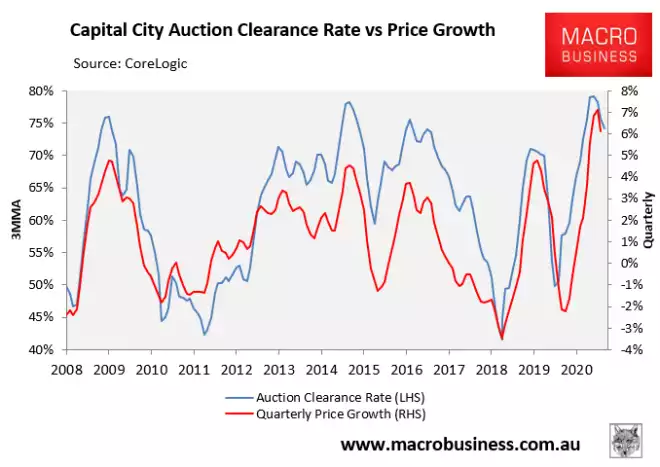
The best short-term leading indicator of price growth is the national auction clearance rate, which has fallen sharply from its March peak; albeit remains elevated from a historical perspective.
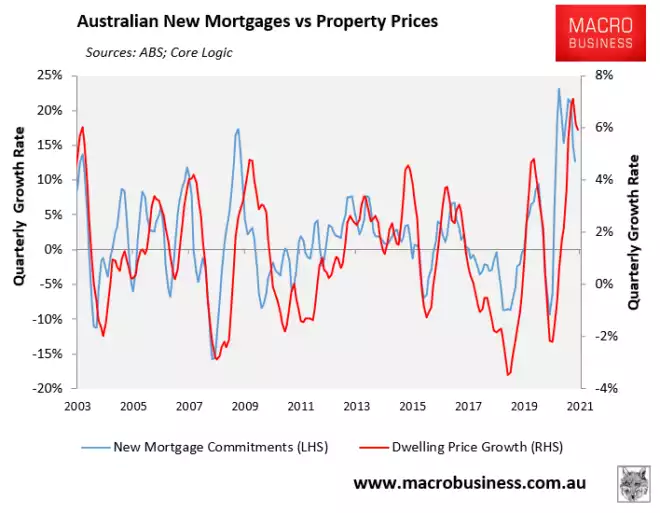
The second best leading indicator for property prices is the growth in new mortgage commitments, which have also turned down:
Later this year, the Australian Prudential Regulatory Authority (APRA) is likely to impose ‘macro-prudential’ curbs on mortgages to cool the market, such as loan-to-value ratio (LVR) restrictions, debt-to-income (DTI) restrictions, increased mortgage buffers, or restrictions on interest-only lending.
These types of restrictions were imposed by APRA in December 2014 and March 2017 and quickly reduced credit growth in the targeted mortgage products.
While it is highly unlikely that the official cash rate will rise over the next 12 months, fixed mortgage rates should also rise moderately owing to the closure of the Reserve Bank’s Term Funding Facility (TFF), which was shut to new drawdowns on June 30, 2021.
The TFF provided low cost three-year funding for banks to support the supply of credit. It was highly successful in replacing more expensive wholesale funding and driving fixed mortgage rates lower.
So, with the TFF now closed, average mortgage rates should rise from their record lows, dampening mortgage and property price growth into 2022.
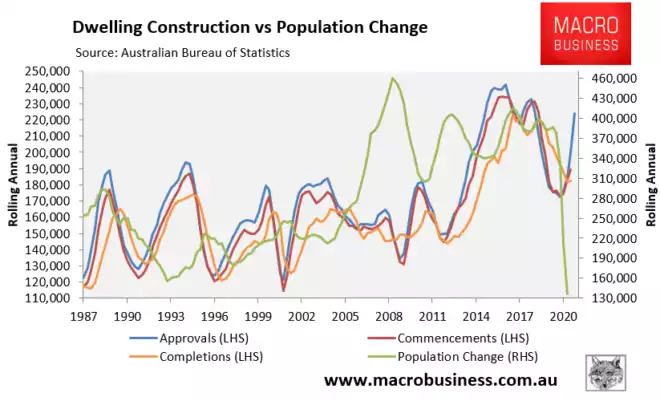
Another longer-term headwind for the Australian property market is the rising supply of homes under construction amid plunging population growth.
The federal government’s Homebuilder stimulus package has driven a huge lift in homes under construction, most of which will hit the market next year. This comes at a time when immigration into Australia is running at century lows, meaning the structural supply of homes will increase sharply (see next chart).
Finally, property price growth should slow on the back of declining affordability. Home values are rising far more quickly than incomes, meaning that an increasing share of buyers are being priced-out. As values rise, the pool of potential buyers will necessarily shrink.
Weighing all of the factors, our base case is for Australian property price growth to decelerate over the remainder of 2021 and then slow more sharply in 2022 once regulatory mortgage curbs are introduced, with the next property downturn to arrive in late 2022 or early 2023.
We do not expect recent lockdowns to alter this trajectory. Previous lockdowns witnessed a fall in both buyer activity and vendor activity before recovering to pre-lockdown levels once restrictions were eased or lifted. Essentially, the low stock levels supported prices while the various markets were placed on lockdown hiatus.”