Gold & Silver Technicals Look Exciting
News
|
Posted 06/02/2018
|
5748
It was another night of big falls on Wall St and markets around the world. At one stage the Dow had lost 6% (1500 points) and finished down 4.6%. Crypto’s too had a brutal night on news of further regulatory crack downs in China with Bitcoin down to just US$6,500 before a strong rebound passing US$7,200 at the time of writing. Gold and silver finished the night stronger, especially in AUD terms on the back of a stronger USD, up $17 (1%) and 27c (1.3%) respectively. This rise in metals is particularly encouraging as it is quite normal for gold and silver to be sucked down in the initial falls as investors sell their liquid assets to cover positions. With these gyrations in gold and silver markets over the last few days it is worth looking at the technicals for hints as to ‘where to from here?’
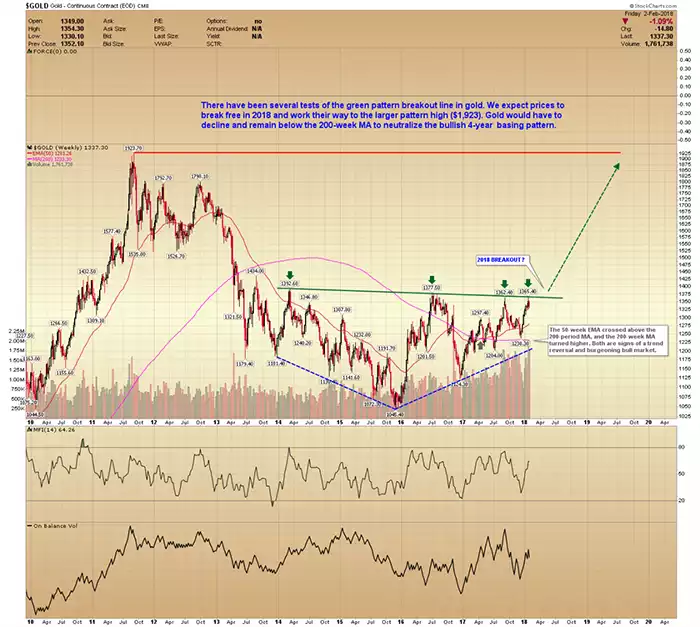
Firstly let’s look at gold. The folks at goldpredict.com just released the following chart for gold and had this to say:
“There have been several tests of the green pattern breakout line in gold. We expect prices to break free in 2018 and work their way to the larger pattern high ($1,923). Gold would have to decline and remain below the 200-week MA to neutralize the bullish 4-year basing pattern. Note: The 50-week EMA crossed above the 200-period MA, and the 200-week MA turned higher. Both are signs of a trend reversal and burgeoning bull market. The multi-year basing pattern in gold is sound. The larger the base, the more meaningful the breakout. Gold attacked the long-term trendline at $1,365 in January and turned back; not unusual. Prices tend to probe a certain level several times before finally breaking free.”
So what about silver? Well you may not have noticed, but on Friday night as silver got pummelled, the Gold Silver Ratio breached an important line in the sand… 80. The chart below (from the TheGoldUpdate.com) shows that has only happened 3 previous times this century:
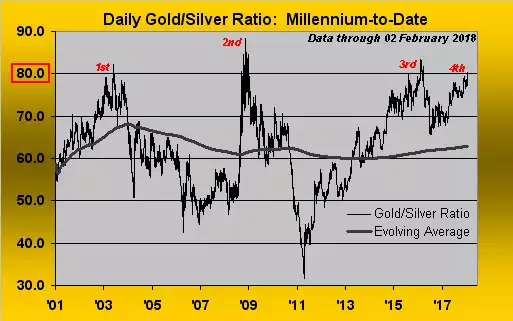
“What happens next? Here's the history of the three prior occurrences looking forward six months in each case:
¦ 1st - 02 June 2003: Silver settles at 4.540; within six months it settles at 5.485 (+20.8%)
¦ 2nd - 17 September 2008: Silver settles at 10.52; within six months it settles at 14.420 (+37.1%)
¦ 3rd - 23 February 2016: Silver settles at 15.300; within six months it settles at 20.665 (+35.1%)”
By comparison in those same periods gold went up 10.3%, 18.3% and 11.8% respectively. In other words when the GSR reaches such heights, silver tends to slingshot past gold on the mean reversion. Keep in mind too that this ‘century to date’ has seen an evolving average in the low 60’s. Over the last century that is more like mid 40’s. When the GSR nearly hit 30:1 in 2011, silver hit $50.
Note too, especially amidst the market moves of the last couple of sessions, the occurrence of these high GSR’s is in the midst of previous market crashes. Given the wobbles on Wall Street and around the world at present it certainly feels like history maybe repeating.