Gold & Silver Holdings Grow with Valuations
News
|
Posted 14/06/2017
|
6446
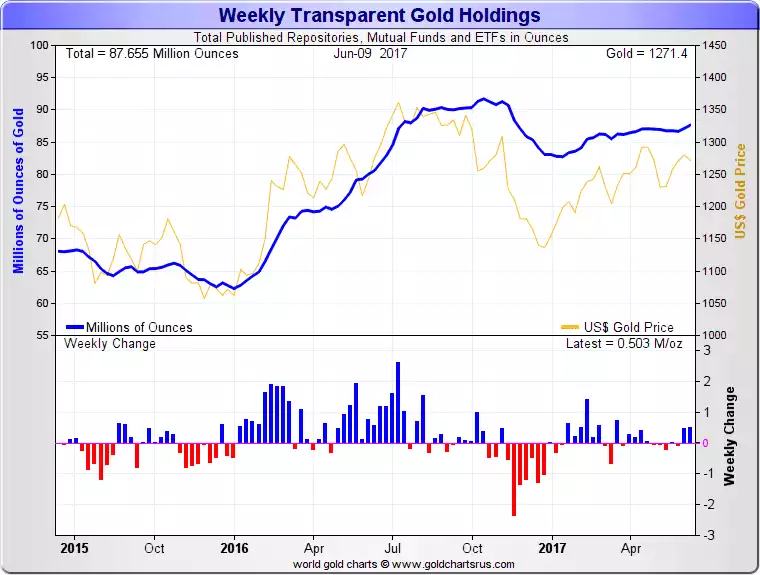
On Friday the World Gold Council published their June update of ETF holdings of gold. Yet again it showed an increase, this time up 10.5 tonne from April to a total of 2,292 tonne (73.7m oz) with a value of $93b. The big growth was in Europe with inflows (20.8t) over double the outflows from the US (-7.2t).
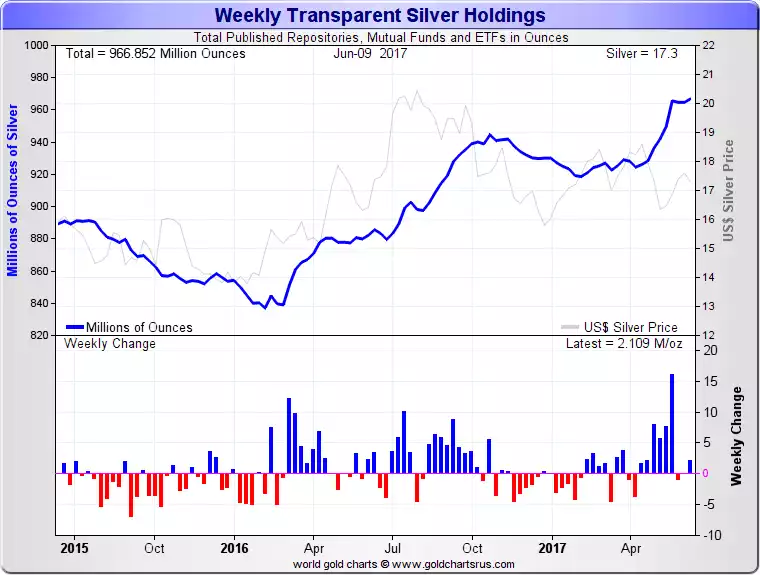
The charts below provide an update of the total gold and silver inventories in all published depositories, mutual funds and those ETF’s above. What is immediately apparent is that whilst the prices for gold and silver are (in the broader scheme of things) essentially bouncing along the bottom (albeit maintaining the Dec 15 low), these various holders of gold and silver are building their stash.
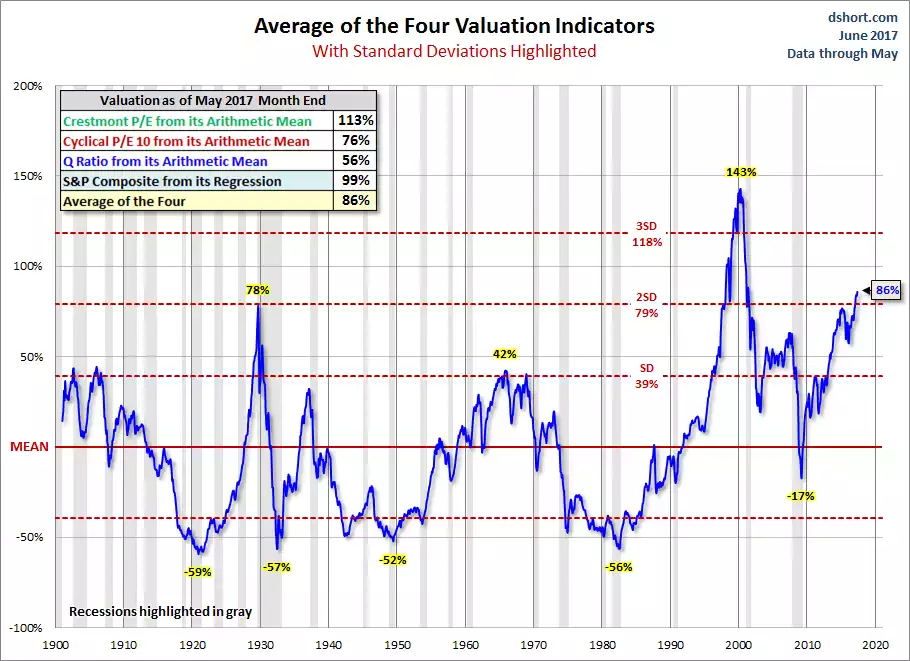
To any but the most ardent equities-centric investor this really shouldn’t be too much of a surprise as valuations on a range of metrics are starting to scream warnings. Courtesy of advisorperspectives.com here are 2 more charts you should be taking note of (and yes, again these are US centric but you well know the US sneeze, Aussie cold history)…
First is an all encompassing combination of 4 different methods (as explained in the table insert) showing that right now we are in the 2nd most overvalued market in history…. ever…
Below is the so called Buffet Indicator, being this legend’s favourite measure of the value of all equities divided by GDP – essentially a price-to-sales ratio for the whole economy…
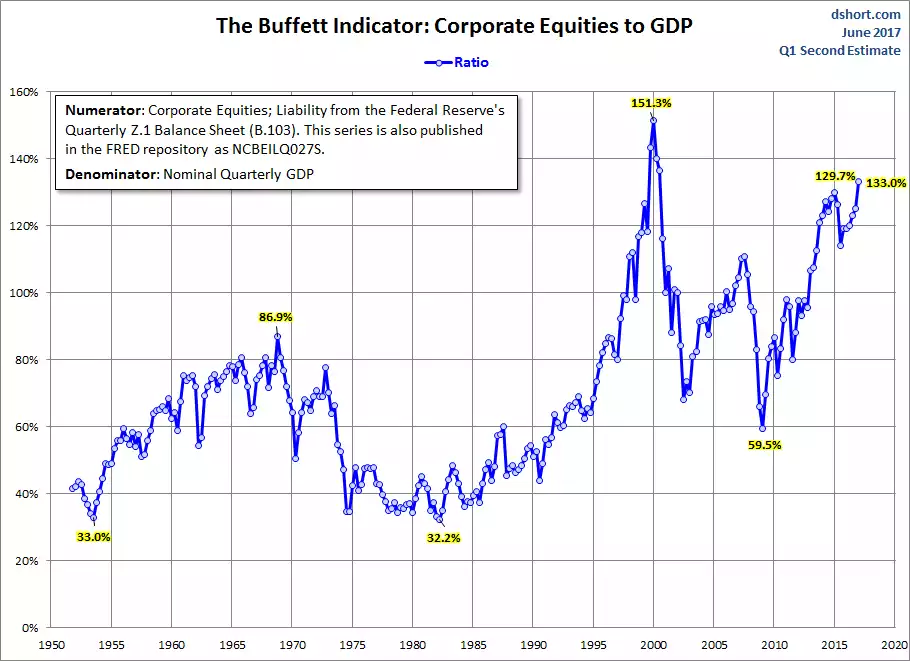
Not too hard to guess why inventories of gold and silver are rising huh….