Gold Production Cost Floor
News
|
Posted 28/11/2018
|
7445
A couple of weeks ago we presented the latest production costs for silver (here). The authors of those charts, SRSrocco, have just published their assessment of gold production looking that the world’s top gold miners.
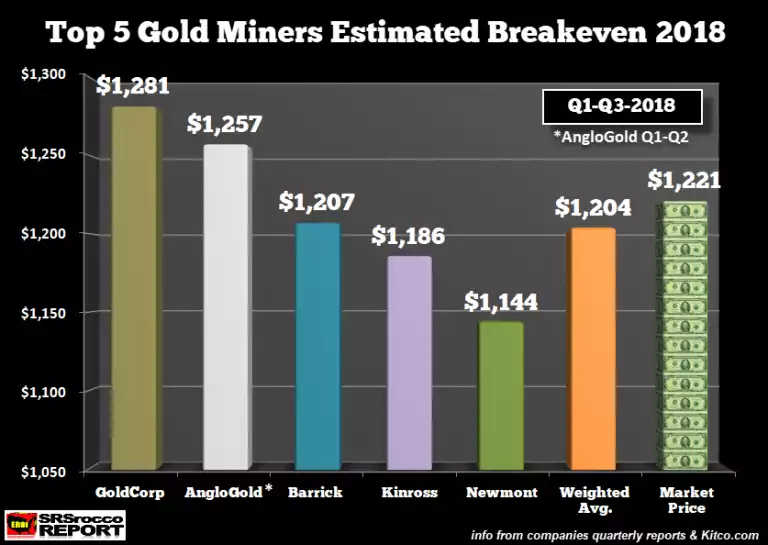
There are many ways to look at what the real cost of mining is from simple mining costs to including sustaining costs etc. They have looked at the estimated adjusted breakeven cost as the most appropriate measure and applied that to the top 5 producers. As we sit here at the time of writing with the USD spot price of $1216 (after losing $12 last night), you can see from the chart below the average of the top 5 is $1204.
Another way to look at it is analysing the free cash flow for the producers by simply subtracting Capital Expenditures (CAPEX) from Cash from Operations.
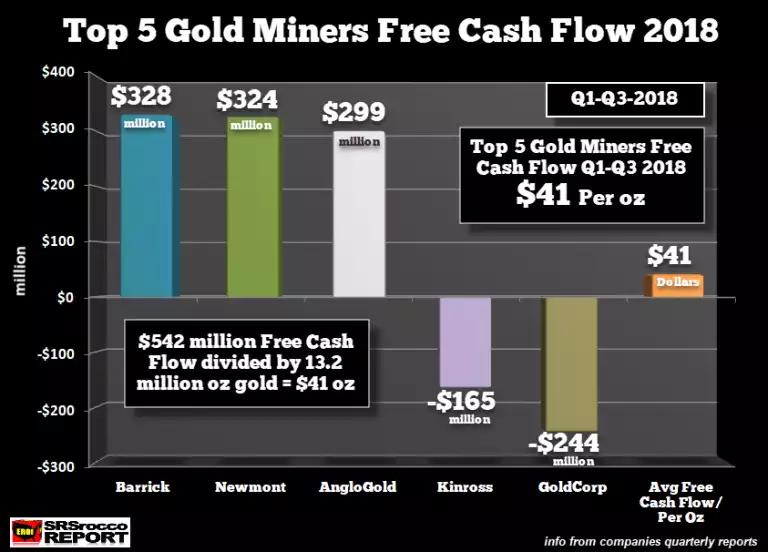
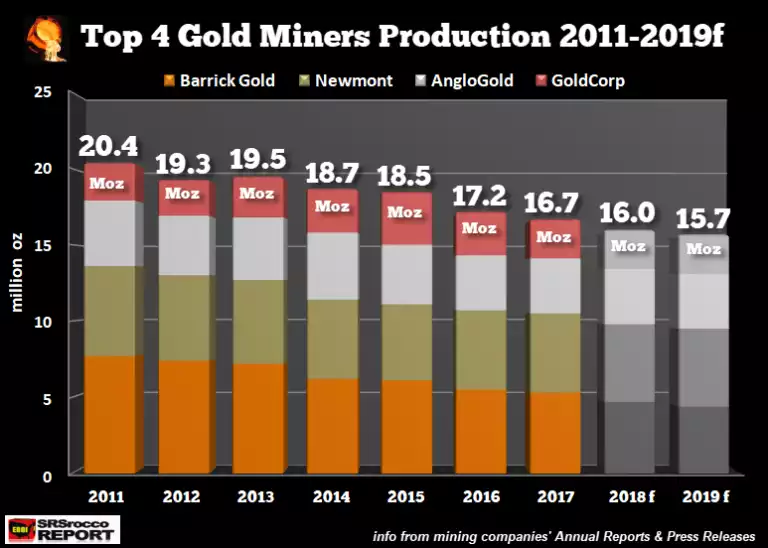
Capex is generally broken into 2 categories – Sustaining (keeping plant running and updated etc) and Expansionary (costs for expanding operations). We’ve discussed previously the decline in expansionary spending when things got tight on the price drop after 2013, leading to fewer discoveries in addition to lower yields and more costs extracting more difficult reserves.
The chart below shows this trend clearly:
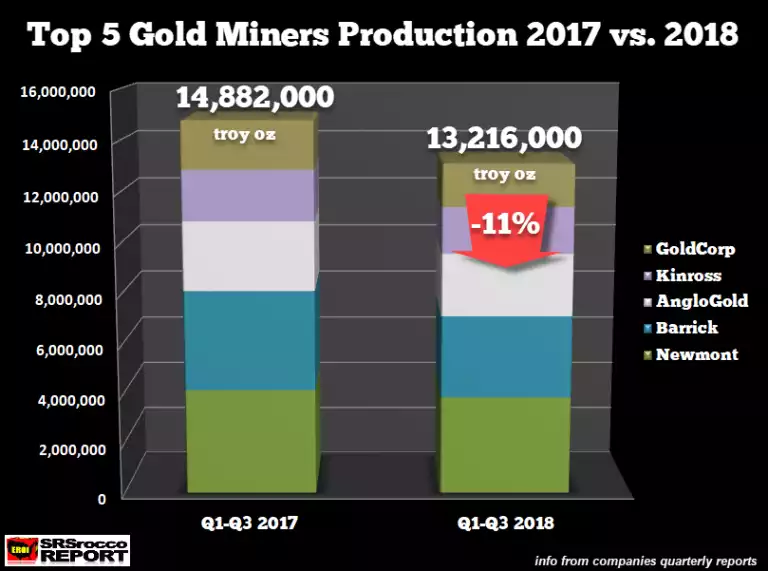
Finally, zooming in on this and last year for actuals on the first 3 quarters, we see an 11% drop in production output:
The gold price has many masters and not all of them make sense all of the time. However the beauty of a rare hard asset is the inherent price floor of production cost. Supply of new gold only increases around 1.5% per year and clearly that supply is on the decline with no magic switch (ala QE) to simply increase it other than a rise in price.