Gold Price Predictor Bullish
News
|
Posted 27/04/2021
|
5767
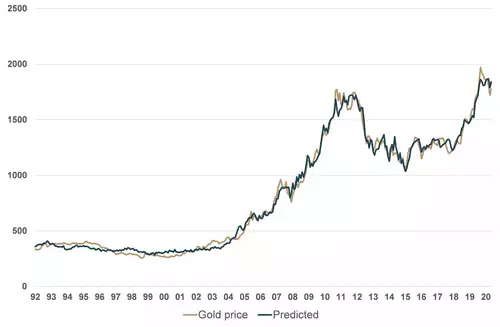
There are many price prediction models for gold however few could boast the historical performance achieved by the guys at GoldMoney Insights. Their gold price framework draws from 3 main drivers:
- central bank policy (through real-interest rate expectations and QE),
- changes in central bank inventories and
- longer dated energy prices.
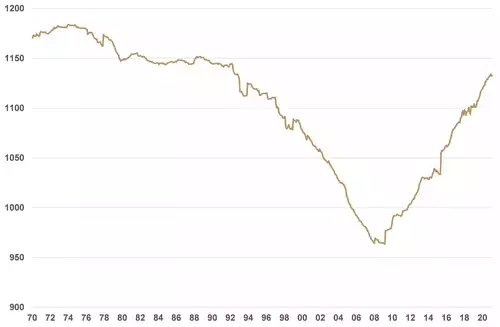
The chart below shows how closely their model has matched the gold price over the past few decades:
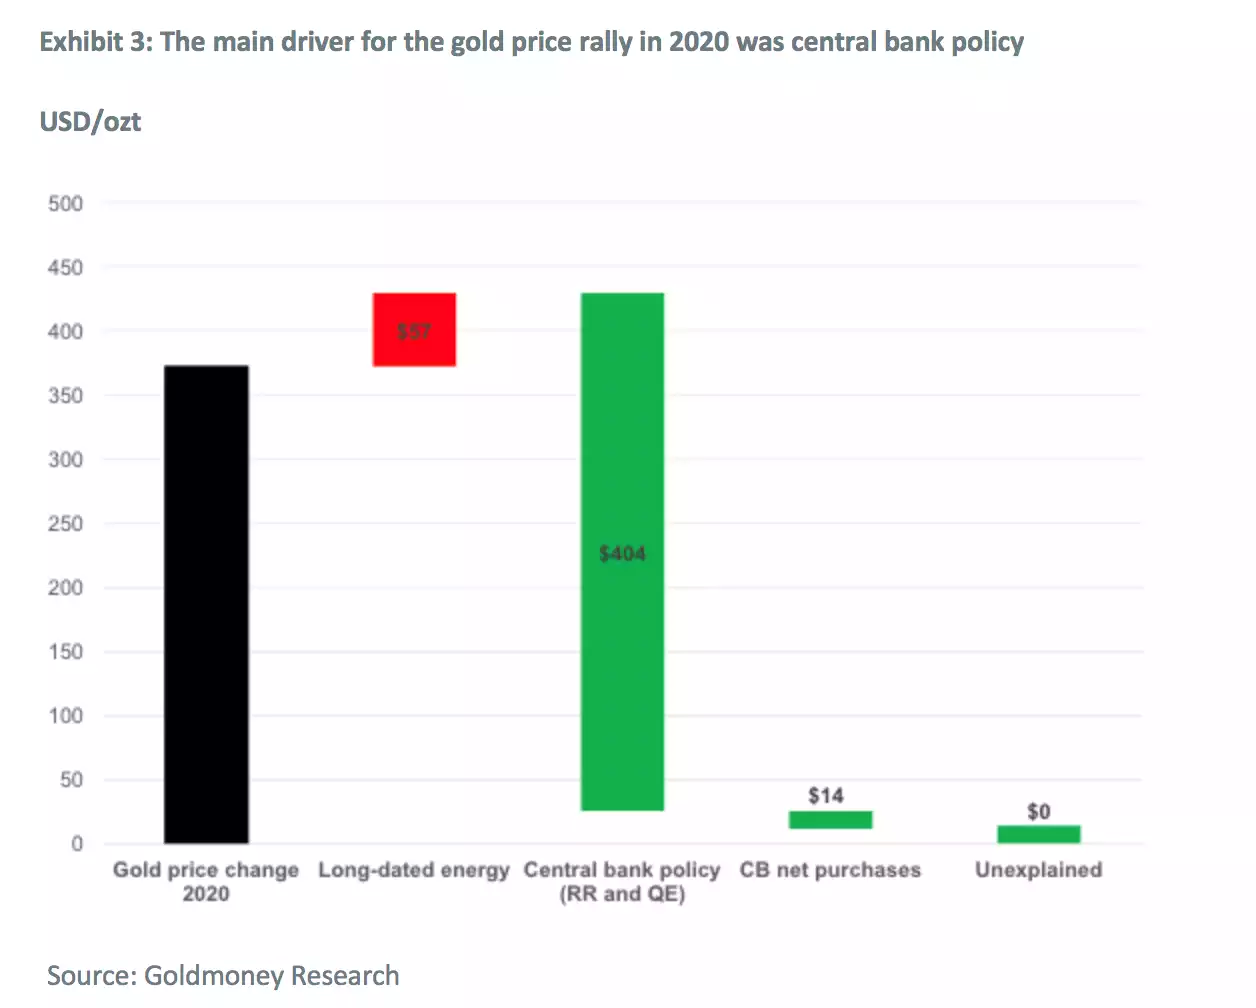
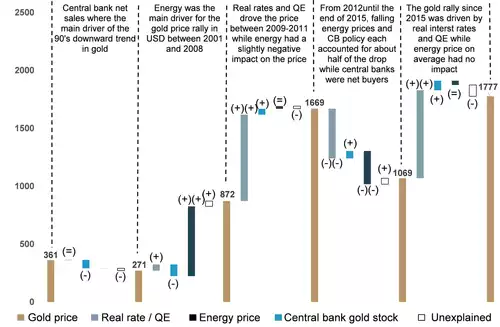
The extent to which each contributes obviously varies depending on the environment at the time. The chart below shows that the 25% rally for gold in 2020 was (no surprises) the real interest rates via the Fed’s massive QE and zero interest rate program.
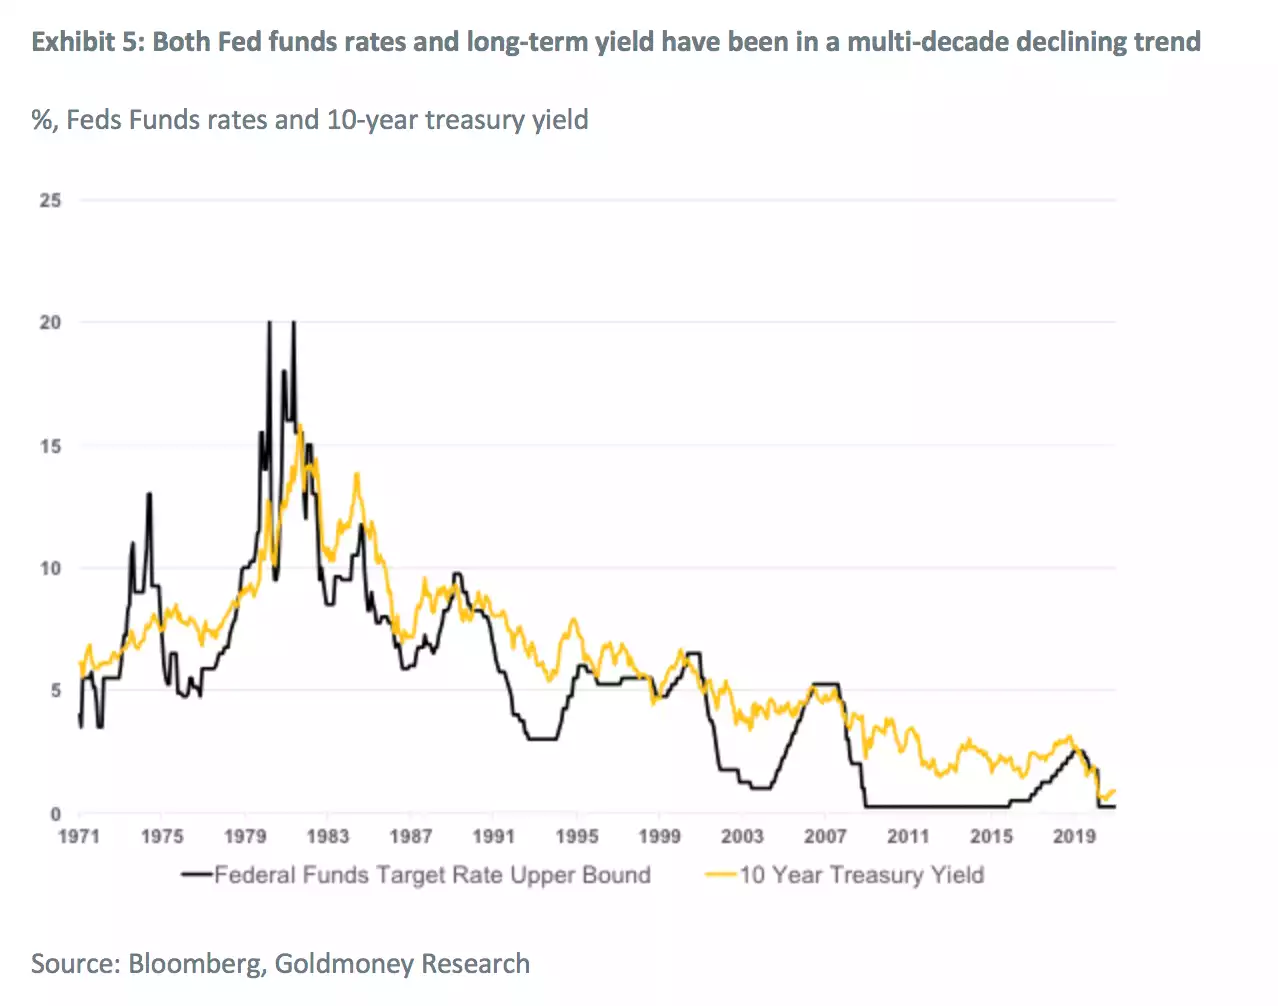
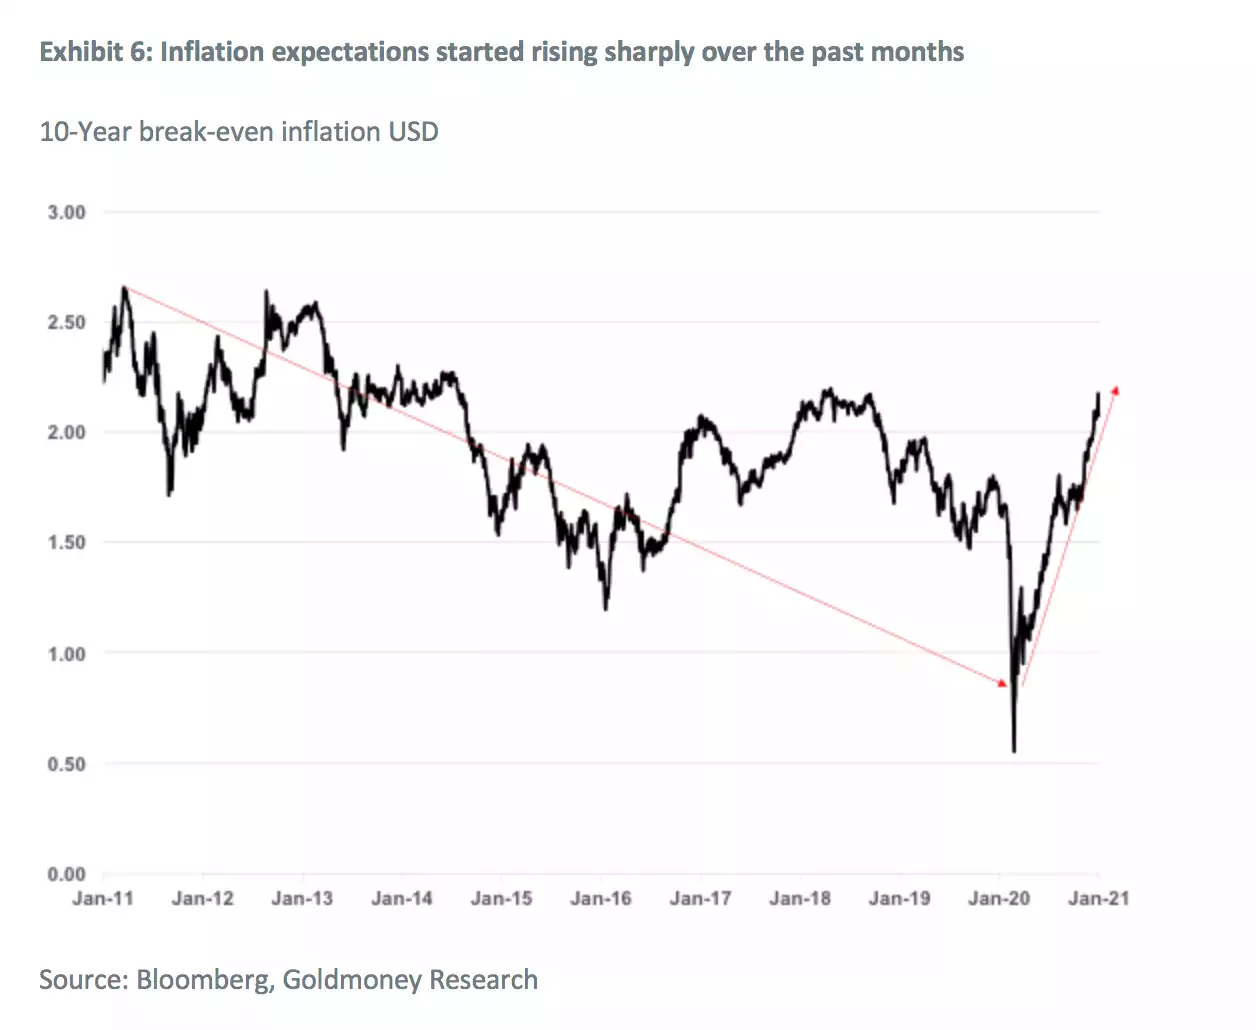
The combination and expected continuance of near zero Fed rates, QE contained US Treasury yields, and increased inflation mean negative real rates are likely here for some time and downward pressure more than upward pressure the likely outcome per the chart following:
In terms of central bank holdings the trend since the GFC remains where emerging market (EM) central banks are solidly buying up, and more so than Western central banks meagre sales. The following chart of world reserve gold holdings tells the story…
And so finally we have longer term energy prices where oil still dominates. The following chart shows “Longer term energy prices were the main contributor to the sharp gold rally between 2003-2008. The US shale revolution eventually led to a sharp repricing of the back end in 2014, which had a net negative impact for gold prices. However, since early 2016, longer term energy prices have barely moved.”
The flash crash of oil last year whilst reducing short term costs instigated long term impacts that will put upward pressure on longer term prices:
“The oil price crash on the back of the COVID-19 lockdowns has accelerated the coming supply crunch. Both national and international oil companies have slashed CAPEX and maintenance spending, which will accelerate decline rates and US shale drillers finally focus on profitability instead of growth. Current longer-dated oil prices are too low to give enough incentive to oil companies to invest in badly needed future oil production.”
“On net, this means that supply will struggle to return to pre-COVID-19 levels quickly as non-OPEC ex US shale will be permanently lower and continue to decline while it will take time for US to reach old highs. US shale oil production is unlikely to grow again at past rates, particularly with current prices. And once US shale production has reached the previous peaks, it will be increasingly difficult to grow much further as high decline rates simply limit to how high production can go. Even before the pandemic, most OPEC countries were already more concerned about maintaining their production rather than growing it over the long run. Low prices and high spare capacity also prompted core OPEC members to lower their CAPEX, at least temporarily.”
Now before you say ‘but we won’t need oil because everything’s going electric!’, that is certainly a trend but a meaningful result is at least a decade away:
“Hence, we believe that the rapid propagation of EVs will have a relatively minor impact on transportation fuel demand over the next ten years. We expect that the average fuel efficiency will continue to increase, but the main driver will continue to be more fuel efficient ICE units rather than electrification. That will start to change after the 2030s if we manage to push EV sales over the 50% mark. This means that the existing car fleet will be gradually replaced by cars that consume little to no transportation fuels. However, for the next 10 years, this means that transportation fuel demand will likely continue to grow, which in turn means, oil demand will likely continue to grow.
Herein lies the duration mismatch between peak supply and peak demand. Once OPEC has brought back all its spare capacity, there is no new significant supply to come online other than US shale oil. But US shale cannot grow for 10+ years at the rate required to meet all the new demand AND offset the declining non-OPEC supply. Hence, eventually, global oil majors will have to sanction some of the projects which they have shelved. But we think this will require much higher prices on the back end. If they don’t, then we face significant supply shortfalls in the medium to long term.
Hence in our view, either longer dated oil prices soon start to reverse their decade long trend and begin to signal producers that their investment is needed. This would be a very positive driver for gold prices. We think the price incentive will have to be substantial as oil producers know that the lifetime of these projects will exceed peak oil demand. Hence, any of the large project sanctioned now will produce decades into an oil market with declining demand. Alternatively, longer dated oil prices don’t reverse the trend now. In that case, we think a massive supply crunch lies ahead of us. In that case, we can expect an explosion in prompt prices, which likely will push the entire price curve higher. The impact on gold would probably be even higher. Either or, we think the trough in longer-dated energy prices in now finally here, and longer-dated energy prices will be supportive to gold going forward.”
“On net, we think we are still in the beginning of the current gold price cycle. While there remain some near-term risk from a spike in nominal rates (potentially triggered by a sharp correction in equity markets), we think central banks are ready to step in and act quickly, limiting the upside to nominal rates. The medium-term outlook for real-interest rate expectations and QE is very positive for gold in our view, and long-dated energy prices present some further upside risk.
Should real-interest rates fall to a similar extent as they have historically in the aftermath of a recession, that alone would push gold prices to around $2600-3100. Such a move over the entire gold price cycle would be in line with the 2008-2011 move of around 270% from bottom to top. Importantly, this scenario would still not assume a sharp pick up of inflation.”
As you can see from the charts above, rarely have we seen all 3 factors contributing to this model as we see before us now.