Fund Manager Survey “Most bearish on record” – MUST READ
News
|
Posted 20/06/2019
|
6760
Yesterday it was the ECB show, sending negative yielding global sovereign debt to a record high and last night it was back to the US Fed who, whilst not dropping rates, has left the odds of a rate cut in July at 100%. A rate cut in July will officially herald the beginning of a turn to easing after a period of tightening into fundamental weakness. History shows this always precedes a recession.
Predictably this saw an exacerbation of the contradictory market dynamics of the normally uncorrelated pricing of ‘risk on’ shares and ‘risk off’ gold and bonds. All are rising with gold smashing through that $US1350 mark last night to finish the session at $US1361 ($AU1975). That is going to have a lot of people on tenterhooks as it is pushing that resistance line we’ve been waiting to see breached for 6 years. It certainly ‘feels’ like it has momentum at the moment but only time will tell.
In terms of shares and bonds the following chart reminds us of how out of whack this is. The S&P500 is very close to the all-time highs reached in early May and the 10yr US Treasury yields nudging just 2%. So who is right?
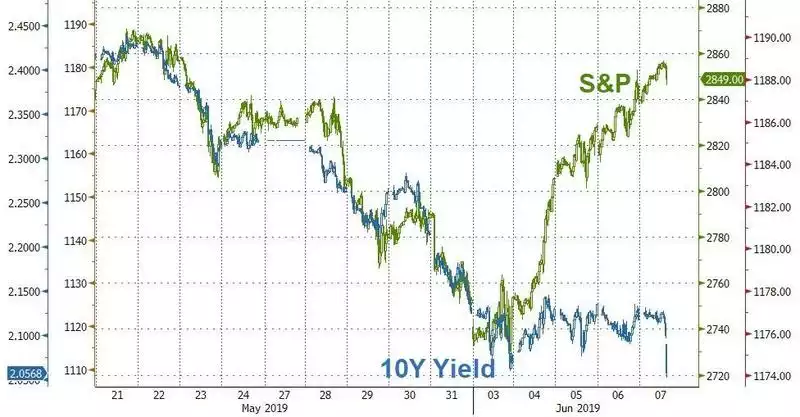
Yesterday we promised the results of Bank of America Merrill Lynch’s latest Fund Manager Survey (FMS). The FMS surveys 230 fund managers with a combined $645 billion of assets under management during the 2nd week of June. For context on that time look to the chart above to see shares were punching higher whilst bond yields turned lower. Given the takeaway of the survey was that this big end of Wall Street were the most bearish since the GFC, it reinforces the question of just who is buying these shares to drive that price up? The safe bet would of course be corporate buybacks. So let’s step through the key findings…
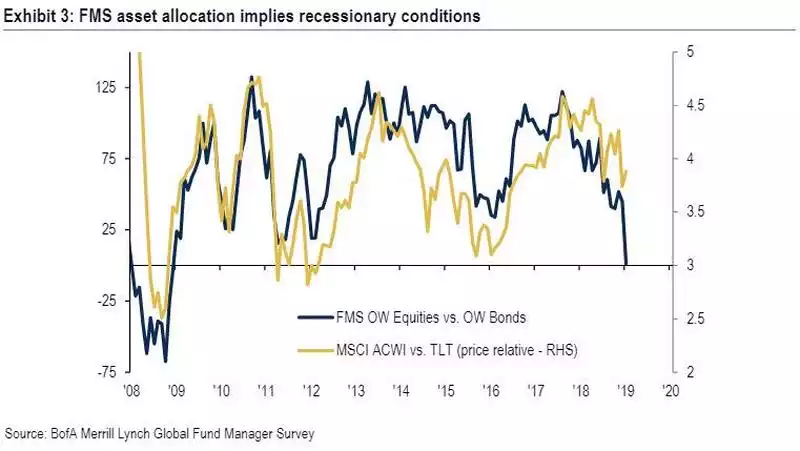
The chart below shows the 2nd biggest one month drop in allocation to shares (relative to bonds) EVER, down a whopping 32% to the lowest level since the GFC.
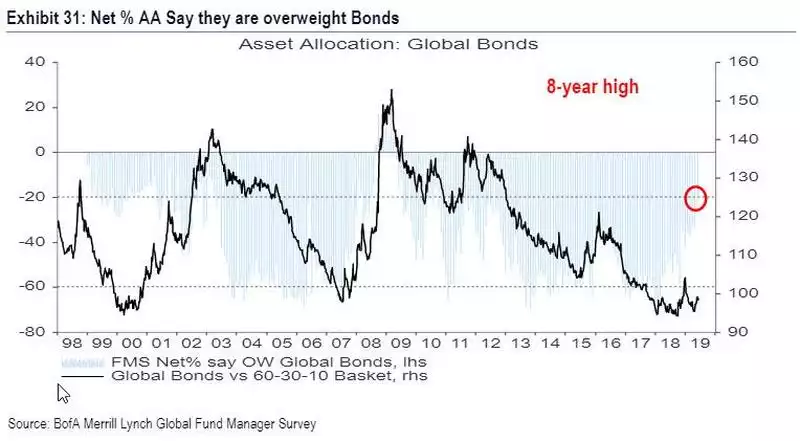
And as the chart above suggests, they have piled into bonds (blue bars) at the highest rate since September 2011, an 8 year high. The black line is a timely reminder of where we are compared to the last 2 US recessions in 2001 and 2008…
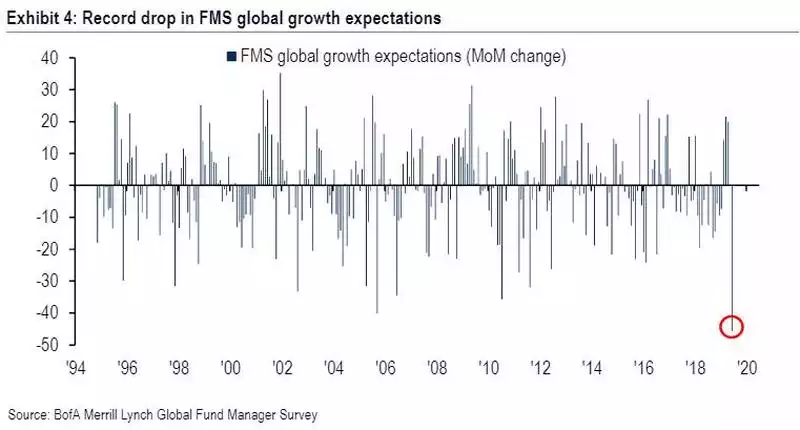
Why are they so bearish? As we reported recently here, global growth is tanking. So it seems are expectations from this crowd, plunging by the most in a month since the 1994 Tequila Crisis (topically from yesterday’s news a currency devaluation initiated crisis)….
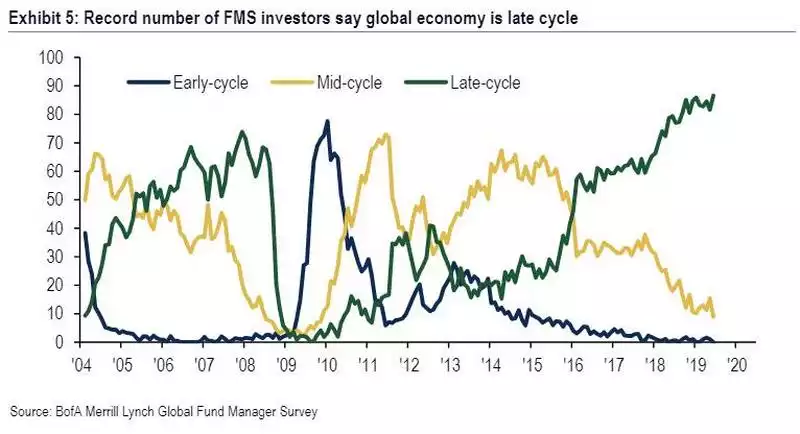
And per that earlier linked article, when global trade tanks to this extent, inevitably so do corporate earnings and the survey saw the 2nd biggest drop in EPS ever. Expectations on how close we are to the end of this global growth cycle are now at the highest level ever, and considerably higher than prior to the GFC.
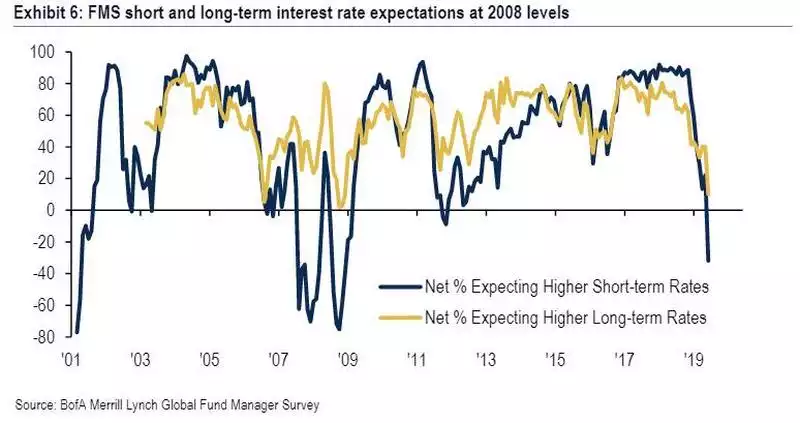
A graph that highlights the shock of the extent of the central bank capitulation from tightening to easy is the expectations of both short term and long term rates, with short term ‘higher’ expectations flipping from +89% to -10% in just 8 months to the lowest since the GFC.
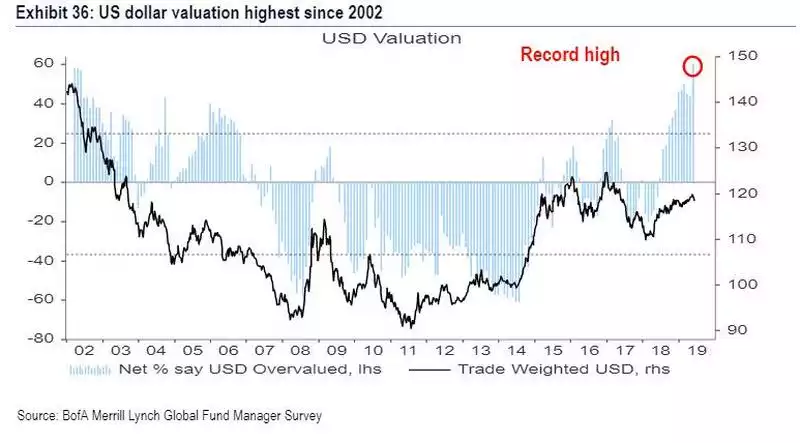
And finally in more good news for gold (as if the above wasn’t enough), another record, 60%, of those surveyed believe the USD is overvalued after a 16% jump in just one month. Look at the black line of USD price from previous such highs…
These are supposedly the ‘smartest guys in the room’ when it comes to investment. They are however Wall St types who continue to have full faith in government issued debt as a safe haven. The 5000 year alternative with NO counterparty risk is of course gold. Is it any wonder gold is continuing to rally in lockstep…