FRED Deflationary Warnings, Gold’s Role & A Lesson From Irving Fisher
News
|
Posted 12/07/2017
|
7015
Despite all the fundamental considerations, the now five week old technical down-trend in the daily gold chart and the near four-month price low reached earlier this week will have some investors asking questions.
Although seeing some price “stabilisation” (in the words of Kitco’s Jim Wyckoff) and a slight bounce overnight, the word deflation seems to be currently trending and perhaps not without cause. In fact just last night Jeff Clark, chief investment strategist and senior precious metals analyst for goldsilver.com tackled this very issue.
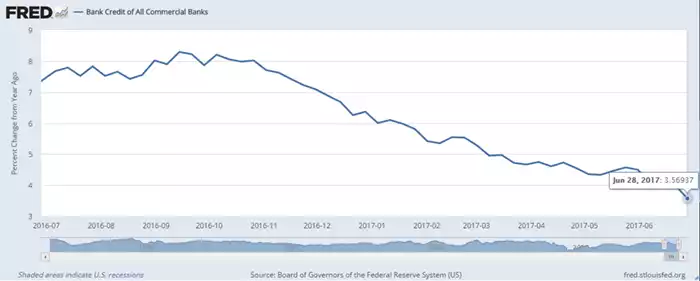
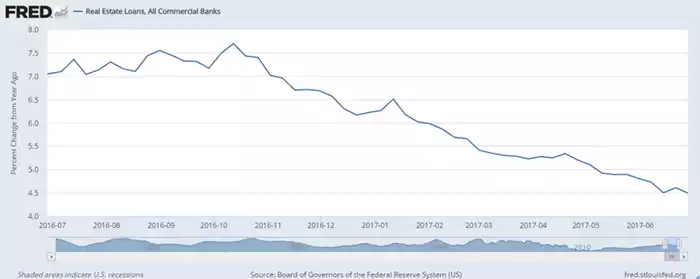
Along with Mike Maloney, the gentlemen provided broad examples of contraction in growth observable in the US right now and we’ve generated the following charts on the Federal Reserve Bank of St. Louis website earlier this morning to illustrate some of their examples. For reference, the following plots use seasonally adjusted weekly data sets in units of “percent change from a year ago” plotted from June 29th 2016 to June 28th 2017, a mere two weeks ago.
Starting with bank credit for all commercial banks we see a distinct slowing of the expansion of credit with the following plot dropping to 3.5% (highlighted) from 7.4% on June 29th 2016. Note that this does not represent a credit contraction but rather a cratering in the rate of credit growth, an ominous warning sign.
Moving on to the plot of commercial and industrial loans for all commercial banks we again see a significant growth contraction from 9.28% on June 29th 2016 down to 1.87% two weeks ago (highlighted).
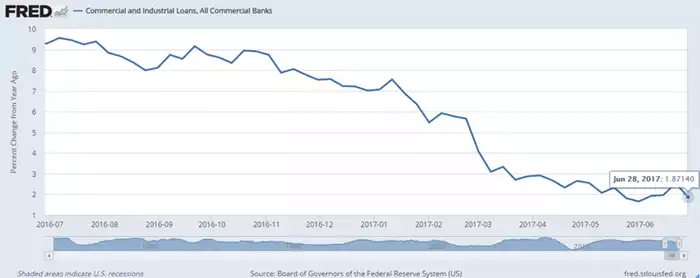
This metric is a bellwether for the economy as it broadly represents the use of credit for manufacturing, warehousing and retail to name a few. Mike Maloney labels this as “an enormous slowing” and “typical of the peak and popping of a bubble”.
Moving on to real estate loans for all commercial banks and we again observe a remarkable slowing in growth, in this case from 7.0% to 4.5%
Taking a break from the charts but continuing with the examples over the same time period we can observe consumer loan growth fall from 8.5% to 4% (a near halving), consumer loans for credit cards and other revolving plans fall from 9% to just over 4% and other consumer loans (automobile loans) falling from almost 9% to 3%.
Lastly (and importantly given Australia’s cultural bias towards property) we can look at growth in residential real estate loans which have fallen from approximately 4% to 1.3%. A sub 1.5% growth rate can be classified as anaemic and Mike Maloney suggests that “pretty soon these charts will probably turn negative”. This is significant with Mike concluding that “if residential real estate loan growth YOY has slowed to less than 1.5% then that means that the real estate bubbles are coming to an end”.
In fact the last real estate peak occurred in the 2006/2007 time frame when growth began to slow, stop and then reverse but it wasn’t until 2008/2009 that the impacts were widely felt. This suggests that disruption may not be around the corner, but it may be just up the road.
Just from this small set of examples, it becomes clear that there are now huge contractions across the board in terms of credit growth and this is one leading indicator of the onset of a recession.
Jeff remarks that “it’s not just one chart showing this trend but multiple and one must hence consider the cumulative effect of all of these things coming to a head all at the same time” and to paraphrase he concludes that this is “clearly pointing to a deflationary outcome which corresponds well to the slowing velocity of money and why we haven’t seen inflation yet”.
To one of the main points of this article, Jeff talks about how he receives a lot of emails asking why it is important to buy precious metals now if a deflation is coming that could see people able to “buy silver when it’s down in single digits” or “buy gold if it drops below $1000”.
There are two strong rebuttals to this line of thinking. Firstly, there’s no guarantee that we will see a deflationary event and secondly, in any deflationary event there’s no guarantee that gold and silver prices will be driven lower.
In fact Jeff explains that the last great deflation pushed gold & silver prices up. “During the great depression, yes gold prices were fixed but the only gold that citizens could buy as private investors was gold stocks and those soared by 400 or 500 percent and that’s just producers only so there’s no guarantee that it’s [the gold price] going to fall”.
Dispelling the idea further is the reality that paper prices tend to diverge from physical prices in these circumstances. “It’s the paper price that goes deflationary, not the physical. During the last financial crisis in 2008, the people who wanted to buy it when it was supposedly cheap ended up paying a whole lot more for it because of the large divergence in the paper price and the physical price”.
Demand for physical bullion increases as people get worried and rush to safe haven assets and that tends to cause shortages irrespective of what the derivative contract price may be. In fact if the deflation is crisis driven then the resulting fear among the investment community could see the paper price just as easily soar.
With the US now in its 3rd longest economic expansion in history we see unjustified levels of confidence or even hubris. A lesson from history comes from famed Yale economist Irving Fisher who famously said “Stock prices have reached what looks like a permanently high plateau” approximately one month prior to the commencement of the great depression.

With Janet Yellen recently voicing her view that we won’t see another financial crisis in our lifetimes, no better argument for an allocation into gold and silver can be made
.