Fed Hikes as Yield Spreads Plummet
News
|
Posted 15/06/2017
|
6923
You may have woken this morning, checked the gold and silver price after last night’s Fed meeting and thought not much happened. A look at the graph over the last 12 hours shows something very different.
Before the Fed meeting the market learned of US retail sales plummeting in May (biggest drop since January 2016) and Core CPI continued to plunge, down 0.1% in May taking the yearly rate down to 1.7% (lowest in over 2 years), both well below expectations. Not exactly what a tightening Fed wanted to hear and the news of which saw gold and bonds both surge strongly.
We then had the Fed meeting where they held strong and raised rates by another 25 points, held to the mantra of one more hike this year, and started to talk seriously about reducing their massive QE stockpile of Treasuries. Gold and silver retreated all of those earlier gains. So goes this farcical data rollercoaster.
In reading reports of this today you may see references to the ‘yield curve’ or ‘yield spreads’ in US Treasuries. One of the key barometers of economic health of a country is the risk assigned between different bond maturities. In a healthy market you would expect a higher yield for a longer bond maturity (say 30 year bond compared to a 2 year bond) given the risk you are taking on holding that longer debt instrument. The ‘yield curve’ maps out these yields against increasing maturities. Logically the flatter the curve the less difference between bonds and lower ‘spreads’ between them, and vice versa for a steeper yield curve.
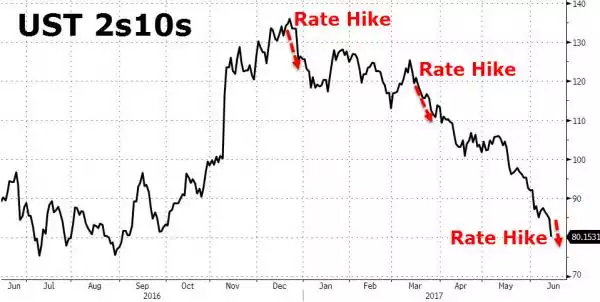
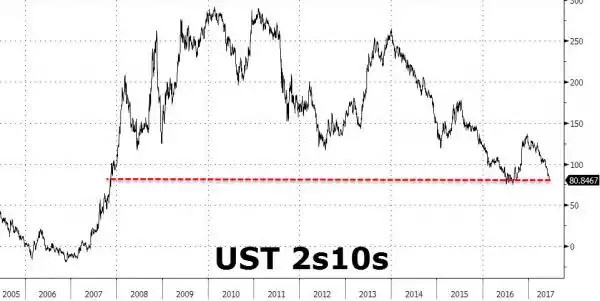
The graphs below show the current short term and longer term yield spreads for the key barometer of that between the 2yr US Treasury and the 10 year (UST 2s10s). As the spread falls, the curve flattens. That is typically an indicator of the market believing both (or either) there will be lower inflation or slower economic growth. What the graph below also shows is we are getting very close to the very rare occurrence of an ‘inverted yield curve’ as the spread turns negative. That has happened only 8 times since 1958 and in 6 of those occasions was followed by a recession.
Right now it is at just 80bps, its lowest since the election and very close to late 2007 (GFC onset).
That the Fed is hiking rates into such an environment is where it gets particularly scary. Whilst indeed gold thrives in an inflationary environment, it is at its most effective as a safe haven when financials crash.