Debt Funded Share Buybacks v Earnings
News
|
Posted 06/05/2016
|
8665
Yesterday we wrote about Stanley Druckenmiller’s views that central banks have exhausted their influence on further gains on US equities.
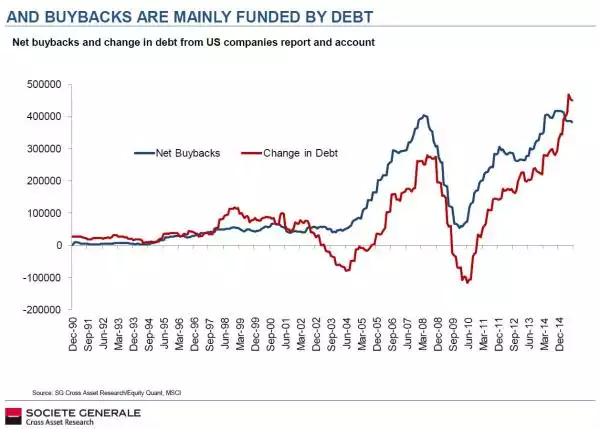
The following charts paint a very clear picture reinforcing his points. As we’ve reported before (here, explaining the mechanics and here, a more recent update) a lot of what boosted the price of shares in the lead up to the GFC and then since the GFC, is companies themselves using this cheap debt to buy back their own shares. This first chart demonstrates this very clearly:
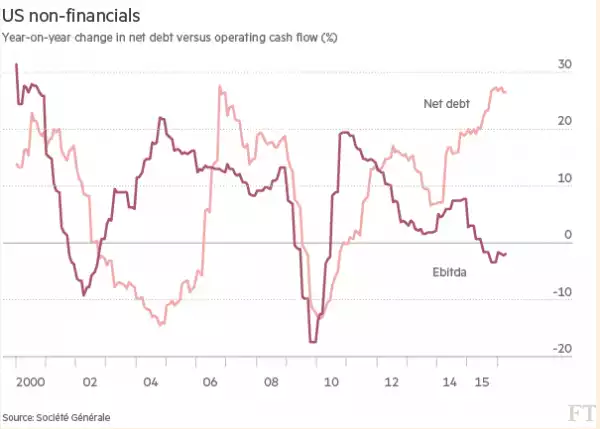
Where this goes horribly wrong is when you can’t generate enough cash to service all this new debt. Regular listeners to our weekly podcast will know that this is exactly what is playing out broadly in the US. Growth is moribund at best and in manufacturing is contracting. The elephant in the room is then what happens when interest rates are raised as we saw leading up to the GFC. The next chart shows the alarming divergence of earnings and debt accumulation for US non financial companies. Now ask yourself if that, in any way, looks sustainable and whether a billionaire who MADE $260m during the GFC might just be onto something….
As a postscript, when you click on the second link above re share buy backs (here if you didn’t) you can see we talked of the ‘lower high’ as a warning for further falls on US shares. Well that’s exactly what happened on 19 April and it has been trending down since…..