Crypto’s Dead! – Just like Amazon
News
|
Posted 14/08/2018
|
8884
“We tend to overestimate the effect of a technology in the short run and underestimate the effect in the long run.”
Known as Amara’s Law after the American researcher, scientist, futurist, and president of the Institute for the Future, the late Roy Amara, this law is one we may all look back on as one of the clearest insights into what is before us right now in cryptocurrencies and the blockchain technology they employ.
CryptoOracle’s Lou Kerner recently penned an incredibly insightful article where he compares the journey Amazon has taken to that of crypto markets.
Like crypto, Amazon presented a completely disruptive shopping platform using the, then, relatively new technology called the internet. Blockchain or DLT (distributed ledger technology) is the new disruptor in town and like the internet it looks like we got a little ahead of ourselves in our fervour of ‘buying’ into it. Or did we… In reference to Amara’s Law, we hand you over to the sage words of Mr Kerner:
“This is part of the reason we get bubbles. We get overexcited about a new technology and we drive up prices beyond any reasonable valuation. Bubbles can go on for years. The internet bubble lasted 5+ years.
It feels like we’re having a Cambrian Explosion in crypto. Just as the Cambrian period enabled the creation of a multitude of new life forms, the emergence of blockchain, cryptocurrency, and decentralization, is opening up a wide range of previously unavailable markets, as well as new ways to compete against entrenched incumbents. Sure, most of the new crypto entities coming in to being today will die out, but many of the ones that survive will be epic.
Given that view, I think the three charts below give additional perspective to the crypto bubble debate.
1. Amazon Price Chart 1997–1999
The chart below looks at the meteoric rise of Amazon’s price from it’s IPO in May, 1997 (at a split adjusted $1.50 a share) to a peak of $105+ in April, 1999. Amazon’s share price went violently up 70X+ in under two years. Was that a bubble?
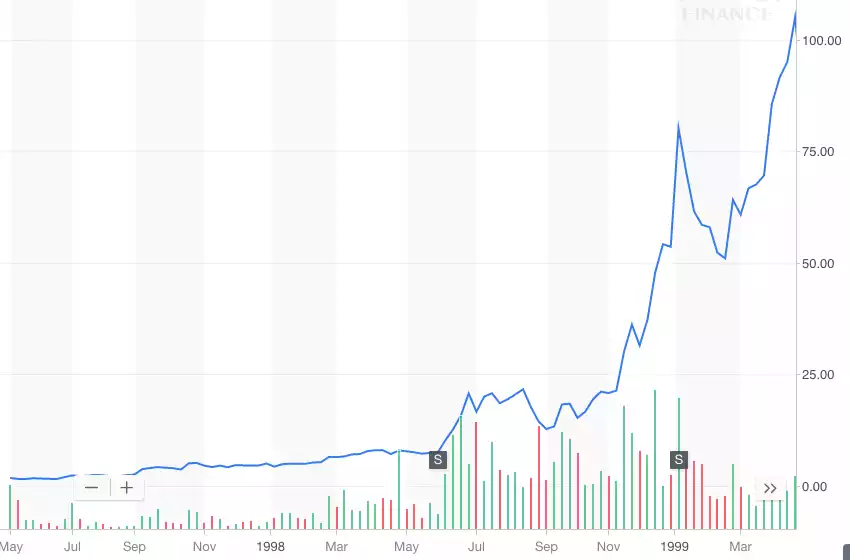
The 2 “s”’s in the brown boxes in the chart above indicate times that Amazon’s share price split.
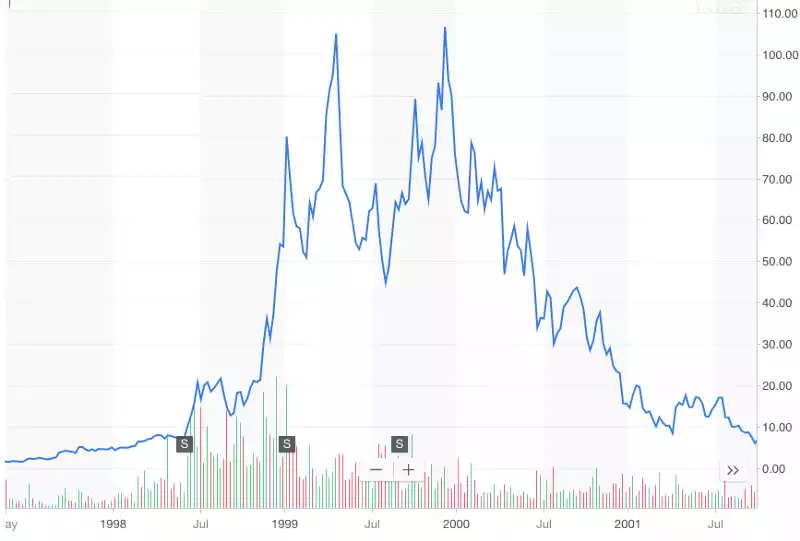
2. Amazon Price Chart 1997–2001
The chart below looks at the implosion of Amazon’s stock price from it’s actual peak in December, 1999, at $106+, to its low of less than $6 in September, 2001. That’s a drop of 95%. Is that a bubble bursting?
3. Amazon Share Price 1997–2017
Since Amazon’s share bottomed out in September 2001, it is up more than 180X to Friday’s close of $1,100. From its IPO price of $1.50, it’s up 275X, generating a compounded annual return of 39%.
With the perspective of more time, when we look at Amazon’s price chart from 1997–2017, that violent up ‘97-’99 (bubble?), and violent implosion down ‘99-’01 (a bubble crashing?), we see it really wasn’t either of those.
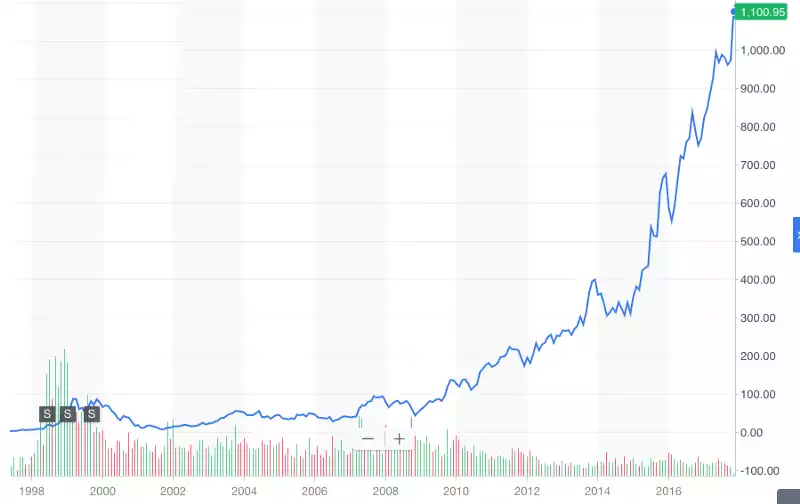
It turns out Amazon’s share price from 1997–2001, when put in to the context of what Amazon became, was just a ……. blip.
In 20 years, when crypto has disrupted as many industries as the internet has, we’ll look back at the previous violent crypto price swings, and the violent crypto price swings certain to come, and they’ll simply be blips in crypto’s long term rise. They’ll be blips in crypto’s massive value creation.
4. In The Near Term, Performance & Price Are Not That Correlated
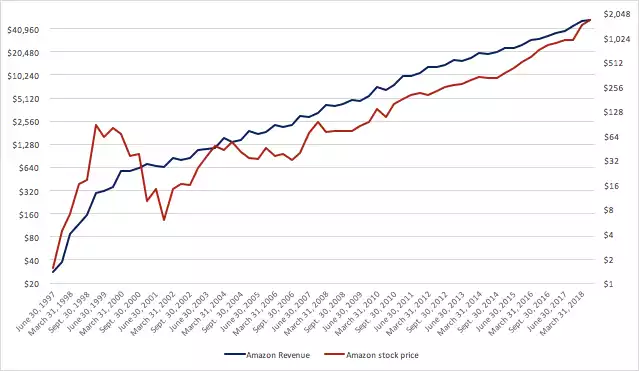
The final graphs below compare the growth of Amazon’s revenue (left axis) vs. Amazon’s share price (right axis). You’d think there would be a high correlation, but it turns out, in the short run, not so much. In the euphoric first year of Amazon being public, the stock price grew at 4X the pace of revenue. The next six years, as revenue grew 400%, the share price fell 40%.
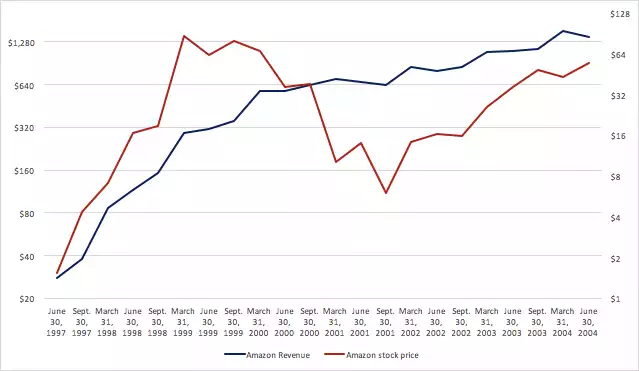
Post the early, volatile years
As the graph below highlights, the early volatile years, gave way to a less volatile price, more correlated to Amazon’s revenue growth.
5. It Turns Out The Most Important Factor Driving Success In Crypto Investing Is ….
In this great TED talk, idealab’s Bill Gross walks through the data driven analysis he did to isolate “The Single Biggest Reason Startups Succeed.” Spoiler alert, it turns out the single biggest factor driving success, is timing.
It’s the same thing in investing. It’s all about getting the timing right. For crypto, it’s all about being there during the violent swings up. While there may be some rare people who can time the market, most of us can’t (even though many of us try). So the only way to get the timing right is to be there. Or as we in crypto prefer to say it, the only way to get timing right in crypto, is to HODL.
So when we look back at these violent price swings in 20 years, they’ll be blips in the long term rise in value that so many of us feel so certain of. They’ll be blips in crypto’s massive value creation that we get to participate in. And most importantly, they’ll be blips on the path to a better (decentralized) planet.”
A lot of the detractors of crypto decry its volatility. As the above article highlights, they may well be missing the point that volatility, borne of its exuberant youth, is potentially its most exciting attribute.