What Does a Bottom Formation Look Like?
News
|
Posted 19/07/2022
|
7171
The Bitcoin market caught a breath of upwards relief this week, rallying from US$18,999 to the upper end of the consolidation range at $21,596. This follows a volatile response across markets early in the week, as US headline CPI inflation hit a forty-year high of 9.1%. There is also a challenging backdrop of growing civil unrest, rising energy prices, the US dollar wrecking ball, and resource scarcity in many nations around the world.
Within this context, the Bitcoin and wider digital assets market have already experienced one of the heaviest, and fastest downwards repricing events in their history. This process has cleared a great deal of excess leverage from the crypto market. While we are still trading down in the doldrums, many on-chain metrics suggest that we have formed what could be a floor.
The Realised Price is one of, if not the most widely recognised Bitcoin on-chain models, and is often considered to be the on-chain acquisition price (cost basis) of the Bitcoin supply. It is currently trading at $22,092, vs current spot price of $21,060, which puts the average Bitcoin investor at an unrealised loss of -4.67%.
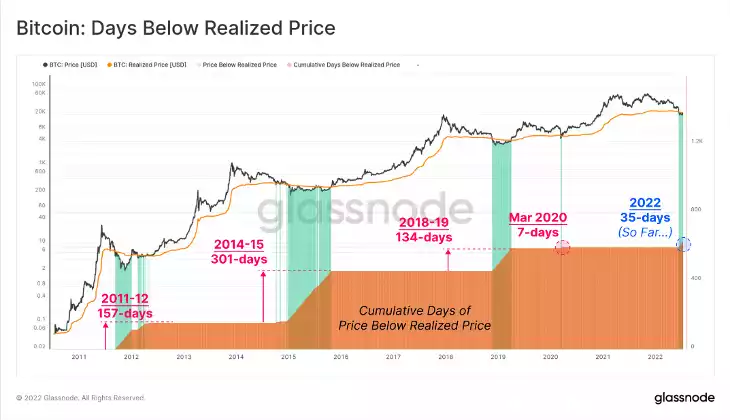
The chart below shows how previous bear cycles have all bottomed and established an accumulation range below the Realised Price. Time spent below the Realised Price ranges from 7-days in March 2020, to 301-days in 2015.
If we exclude March 2020 (a flash event), the average time spent below the Realised Price is 197-days, compared to the current market with just 35-days on the clock.
This could suggest that we have more time trading rangebound at the bottoms. However, this does not mean that there isn't a chance to find profits. In the last week, ETH has gained a whopping 53% - even though it is still trading down 80%~ from the all-time highs.
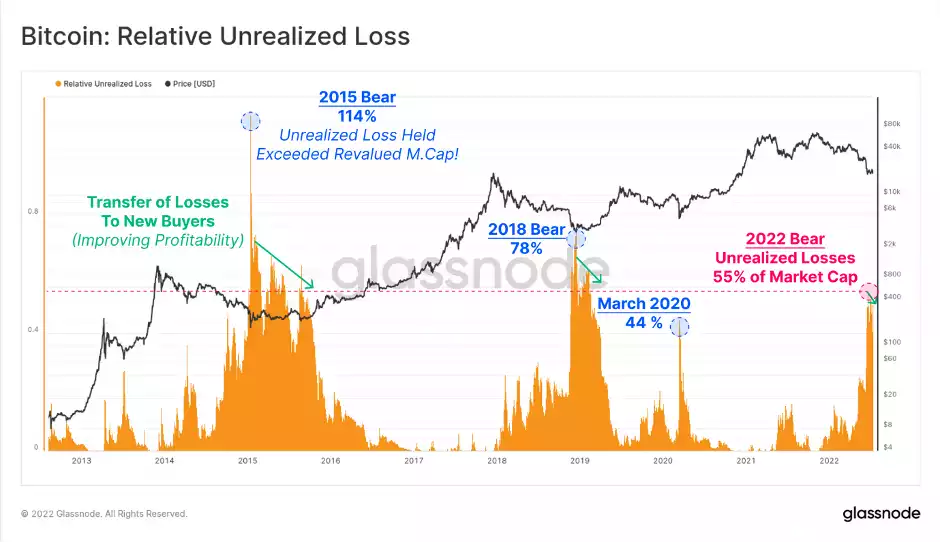
Back to BTC, the chart below shows this total unrealised loss, as a proportion of the current market cap, to normalise for size. Here, we can see that the total unrealised losses are equivalent to around 55% of the market cap, which is larger than in March 2020, and not dissimilar in magnitude to the 2018 bear market lows.
The key points in this chart are:
- Coins are sold during capitulation events and bought by lower-time preference buyers.
- Losses transition from unrealised to realised
- Coins are thus re-valued to a new and lower cost basis, with a new owner.
- As prices start to rise, these newly acquired coins switch from holding an unrealised loss to an unrealised profit, usually starting the bullish cycle again.
The Bitcoin market has corrected hard, and fast in 2022, driven by the unwind of excess leverage, and a plethora of forced sellers and liquidations. In a relatively short 7-month period, BTC has traded from an ATH, all the way into what resembles a bear market bottom.
Against a backdrop of extremely challenging macroeconomic, and geopolitical turmoil, Bitcoin is reaching peak investor saturation by high conviction HODLers, and it is becoming quite plausible that a genuine bottom formation could be underway. Let’s see where the next week takes us – higher highs and higher lows would provide a lot of clarity for what the future holds.