BTC On-Chain Divergence
News
|
Posted 31/08/2021
|
7831
Even at the best of times, the price action in the crypto market can be hard to digest and make sense of. As we quietly make a push up towards all-time high levels, the obvious question is who is buying at the moment? Fortunately, Glassnode released their weekly report which perfectly explains the market dynamics at the moment and provides some clarity. Let’s have a look at what they’re saying:
An on-chain divergence has developed between price, on-chain activity and supply dynamics, creating a market structure similar to an early bull impulse for BTC. The Bitcoin market entered price consolidation this week, largely hanging onto the impressive gains since the bottom set in late July. Prices traded between a weekly low of $46,465 and a new local high of $50,461.
As the Bitcoin and wider cryptocurrency market rallies higher, a remarkable on-chain divergence continues to form across both Bitcoin and Ethereum. On-chain activity on both chains has remained quiet relative to bull market highs, even as price momentum continues upwards, and bullish trends in supply dynamics remain in play.

With prices pushing above $50k, and some notable profit-taking covered last week, the market currently sits at the top end of a very high on-chain volume node.
The chart below shows the price bands where the current BTC coin supply was last transacted. Since breaching last cycle’s $20k ATH, three distinct on-chain volume bands have formed:
- $31k to $40k (Price Floor) where over 2.98M BTC were accumulated, both in Jan 2021 and in the recent 2.5-month-long consolidation. This is likely now a very strong underlying support zone.
- $45k to $50k (Current Range) where 1.65M BTC have a cost basis. With the price at the top end of this range, it is likely that this too could act as strong price support.
- $53.7k to $59k (Trillion Dollar Asset) where 1.336M BTC were accumulated between March and May and are still holding unrealised losses. These coins are those that remain unshaken by a 50%+ correction in May but could also become overhead resistance if investors seek to exit at their cost basis.

Within this context, profits have continued to be realised throughout August as prices continued to trade higher. This suggests an underlying market strength, capable of absorbing this spent coin supply. The aSOPR metric shows that similar behaviour was observed after the March 2020 sell-off with the following sequence of events:
- Capitulation where losses were realised by panic sellers for an extended period of time.
- Profitability Returns as signalled by aSOPR trading and holding above 1.0. This suggests profits are realised but market strength is sufficient to absorb sell pressure.
- Buyer Conviction Returns as aSOPR resets to 1.0 on several occasions, and then bounces higher, suggesting holders of profitable coins prefer to stay dormant, and investors are buying the dip.
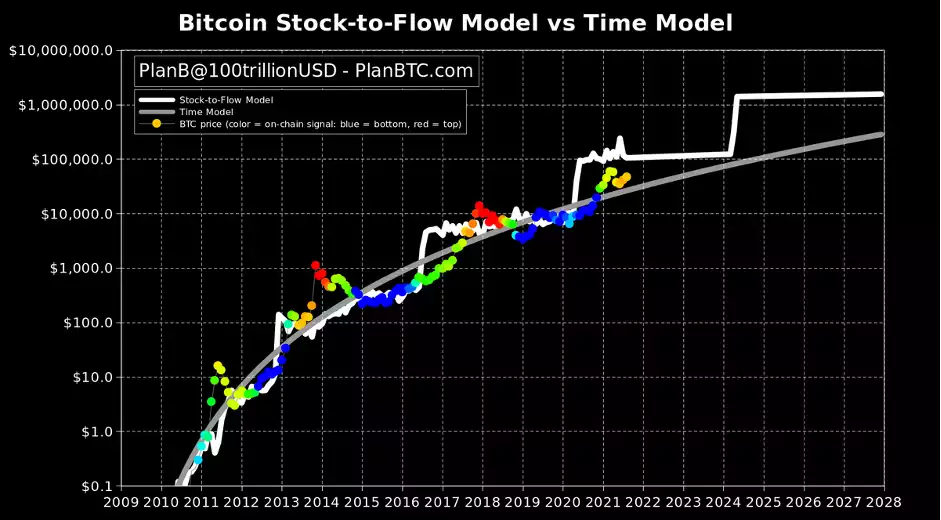
Glassnodes bullish outlook aligns similarly with Stock-to-flow creator PlanB’s outlook. After the price dropped off in the last week, Plan B was still confident that the bitcoin "bull is not over." Following the last S2F update, Plan B spoke about his model on August 27th and gave a prediction.
"Bitcoin stock-to-flow model predicts $100K by Christmas," Plan B tweeted. "Time model (diminishing returns, lengthening cycles) $30K. The next months will be key. Note that colour overlay is on-chain signal (not time to halving), indicating we are between the bottom (blue) and top (red), in line with S2F.”
Whilst the divergence between price and on-chain activity is historically abnormal for a full-scale bull market, it is not an uncommon signature for the pre-bull, and pre-supply-squeeze dynamic. These periods often accompany the end of bear market accumulation where the investors who remain, are the strong hands, those with the highest conviction. Just last week Microstrategy added another $177M US to their BTC holdings… high conviction buying.
Supply dynamics seem to suggest an extremely robust underlying demand is present, and this should continue to be quite constructive for prices if the trend continues. Let’s see where the rest of the week takes us…