Barefoot & Dangerous
News
|
Posted 19/01/2018
|
9773
Today we would like to address some ‘analysis’ published in one of the top selling books at the moment, The Barefoot Investor.
The book calls gold a ‘crummy investment’, backing this up by quoting a study starting a comparison of gold and shares from 1802. That study shows a dollar investment in gold is now a mere fraction of that same dollar invested in shares in 1802. Now we’re not too sure about how many of our readers commenced their investment portfolio in 1802, but we’d guess not many. For much of the period from 1802 to 1971, gold’s price was largely set and set deliberately low by Government decree. In 1971 the world left the gold standard and gold became a free market whilst ‘money’ became a fiat currency, backed by nothing but the promise of a government, and heralding the beginning of a new credit super cycle.
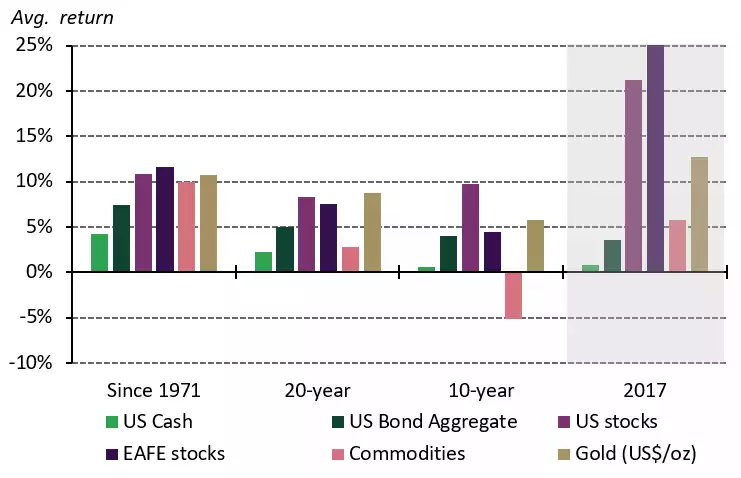
The following graph (courtesy of WGC) shows the relative performance of major investment assets since 1971, or for context, for the most recent 46 years of the last 215 years back to 1802….

*As of 31 December 2017. Annual return computations are based on total return indices, except gold where the spot price is used. This arrangement more accurately reflects portfolio level performance.
Source: Bloomberg, ICE Benchmark Administration, World Gold Council
Crummy indeed…. Note the fine print that this is indeed total returns, and so discounting the ‘shares yield, gold doesn’t’ argument.
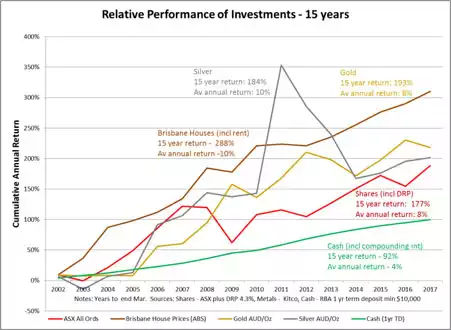
If you think that is all very US centric and not relevant here, below is our last update to our 15 year comparison of local assets and gold (and silver) in AUD…

Still not seeing the crummy-ness?
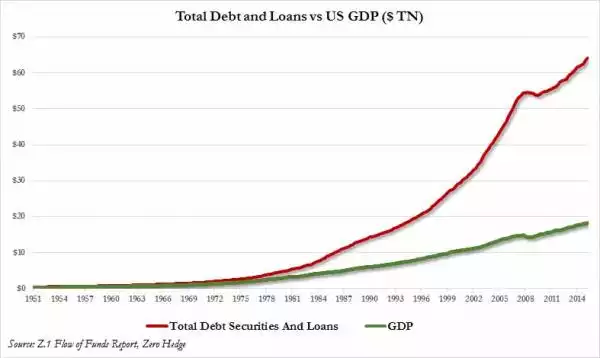
Way back in 2016 we wrote this piece about the 45th Anniversary of the commencement of this historic credit cycle starting in 1971. In that article we pointed out: “In 1971 US debt was $370b. It is now up 5,245% to $19.4 trillion or 117% per year”. And just how exactly has all that debt ‘paid off’? Check out the staggering graph below. Note too in which year the 2 lines started to diverge….

Now if you see the above graph of debt needed to produce GDP as completely sustainable then gold and silver are not for you and will likely be ‘crummy’.
Let us finish with a salient reminder of the danger of selectively ‘picking your sample period’. The news is awash at the moment with Bitcoin being down and a bad investment with many references to ‘year to date’.
2018 Year to date
Bitcoin is down 14%
S&P500 is up 4.6%
Conclusion – Bitcoin is a crummy investment, shares are awesome.
Sample period – 19 days.
2017 Returns
Bitcoin was up 1259%
S&P500 was up 20%
Conclusion - …. Well, you get the idea….