Are You Buying The Dip?
News
|
Posted 23/11/2021
|
6384
The Bitcoin price tumbled this week from a high of $66,281 to a low of $55,705, rattling a previously quiet and bullish run-in price action. While price stays pinned below new highs and sentiment remains scattered, Bitcoin's stakeholders are actively adjusting to new market information. This has shown up as a recent shifting of coin distribution amongst holders, which will likely impact the market's short-term response.
There have been 3 primary onchain factors that are influencing the price right now;
- The sharp move lower in price, the aftermath of overhead / unprofitable supply associated with it, and holders' spending behaviour in response to volatility.
- The "big picture" market trend which remains in play, which will aim to provide context on where things stand and considerations moving forward.
- Short term holders (STH) and their active role in the market this week, and in aggregate.
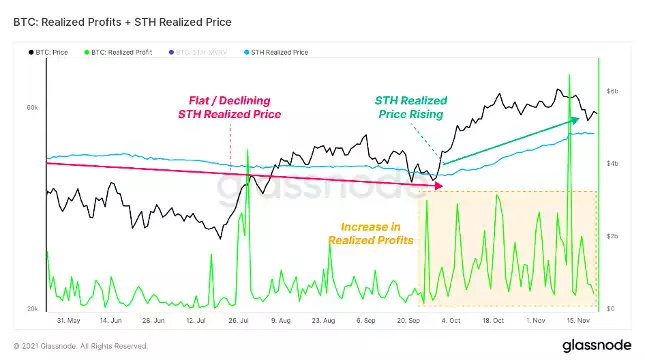
This last week Realised Profits have been increasing and elevated since reaching $60k+. Realised Losses have also been flat for weeks, a natural by-product of upwards trending price action. As a function of these two dynamics, the Realised Cap has broken to new highs, establishing a higher plateau for the network-wide cost basis.
Generally speaking, spikes in on-chain profit-taking during bullish impulses are to be expected as the price climbs to new highs, and are typical for any bull market. As the realisation of profits increase, so too does the probability of establishing a macro top. So, an increase in Realised Profits and Realised Cap generally indicates that:
- Increased realisation of profits is an estimate of sell pressure, which needs to be absorbed by an increasing inflow of demand to maintain sideways or upwards price momentum.
- The buyers of these coins (i.e. Short Term Holders) have an elevated cost-basis, making them more sensitive to shorter-term moves in price.
The combination of these factors can cause a stall in market momentum, and establish a local top. One tool to identify this shift in momentum is the 28-day Market-Realised Gradient.
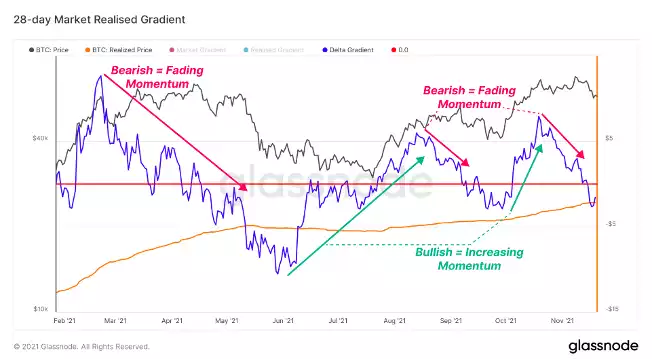
Before the price drop this week, the 28-day Market Realised Gradient displayed fading momentum with a sideways price. This same signature occurred before the steep price drop in May, and the initial rejection from $50k in September. As price made higher highs, the momentum behind each one was declining, creating a bearish divergence.
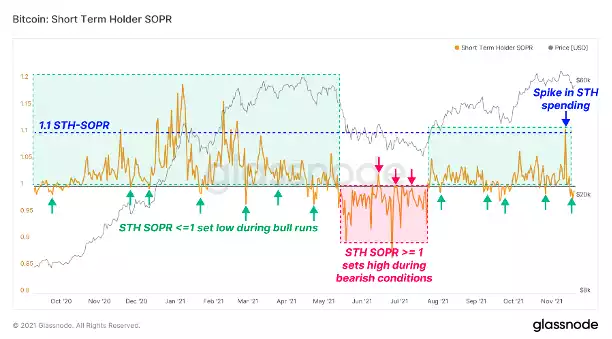
Short term holders (STH) are most responsive to price action due to a combination of having a higher relative cost-basis, a higher time preference, and potentially a lower degree of conviction in the asset. This week's price action was no exception, as STHs played a role in setting both the highs and the lows:
STH-SOPR spiked to 1.1 near the highs of the week, a historically high value and one that is associated with large amounts of profit-taking. STH-SOPR dipped below 1 near the lows of the week, a value that has historically bounced price during bull runs as STHs cost-basis gets tested and top buyers capitulate. STH-SOPR remaining below 1 for an extended period would be a signal to market participants to take caution and increase the probabilities of an extended downside. STH-SOPR values on the macro scale remain relatively flat compared to the early 2021 price run-up, possibly signalling that the market hasn't become overly saturated with profit-taking yet. This is a more constructive medium-term observation.
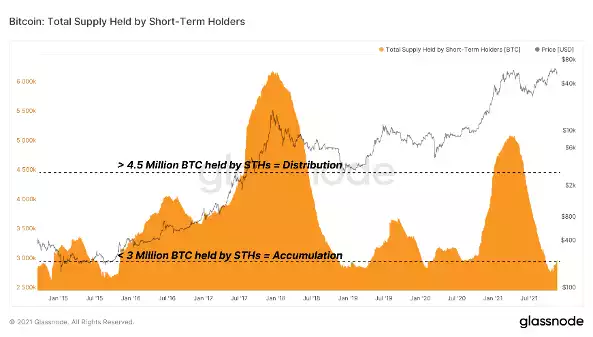
This trend of the long-term holder (LTH) HODLing can also be seen in the supply dynamics. The total supply held by STHs can only increase in three instances:
- When new coins are being mined (which have zero-coin days accumulated),
- When coins are withdrawn from exchanges, or
- When LTHs spend their holdings.
The chart below shows that the total supply held by STHs is at multi-year lows (<3 Million BTC), which means LTH supply is at multi-year highs by contrast. Low STH supply is typical at the end of bear markets and in early bull markets, usually following long periods of accumulation. Seeing STH supply this low whilst price is near ATHs is a relatively unique case.
A final bit of insight was offered by analyst and pseudonymous Twitter user ‘TechDev’ who posted the following charts comparing the 2017 price action for Bitcoin with the current market.
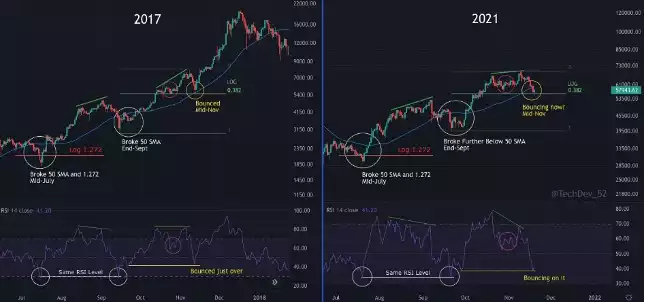
According to TechDev, the current correction is “following 2017's mid-Nov to near perfection” with the “only minor difference” being “a break of the 50-day simple moving average (SMA).”