All Things Are Relative – Gold v Financial Faith
News
|
Posted 14/04/2020
|
15516
Perspective is everything when one needs to size up an unprecedented situation. Who would have thought over the course of just a decade the word trillion would be so readily thrown around in monetary terms. To get a mental image of what a trillion is remember that 1 million seconds is around 12 days, 1 billion seconds is nearly 32 years and 1 trillion seconds is 31,710 years. So with that in mind, consider the US Fed, just one central bank, increased the supply of USD by over $2 trillion in just the past month. That is more than all of the $1.7 trillion QE3 program that went for over a year.
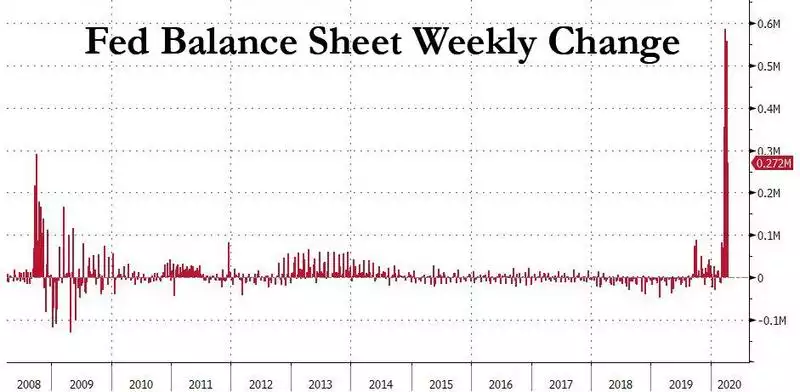
Lets look at that cumulatively charted and projecting their stated purchases forward to the end of this week taking their balance sheet of purchased debt to over $6 trillion.
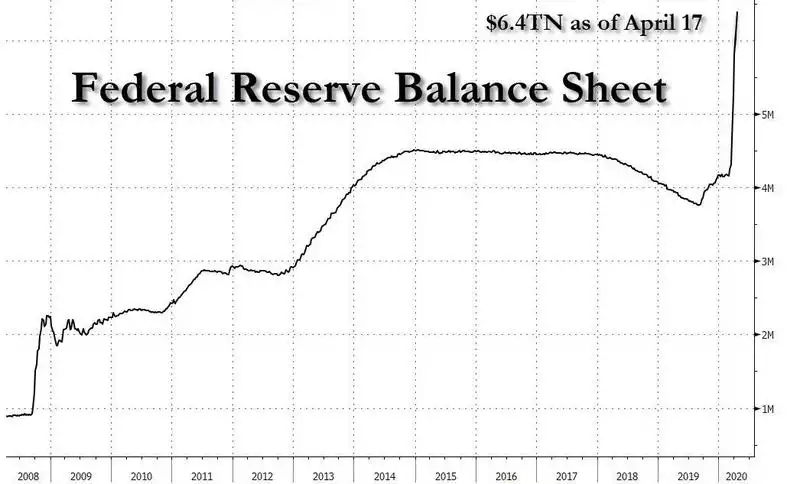
However to fully grasp that you need to look back a little further. The Fed was established in 1913. From 1913 to 2007, 94 years, it expanded its balance sheet by $800b in total (no sign of the word trillion yet). Then the GFC happened and they came up with the idea of pumping the market with money called Quantitative Easing (buying bonds with freshly printed USD).
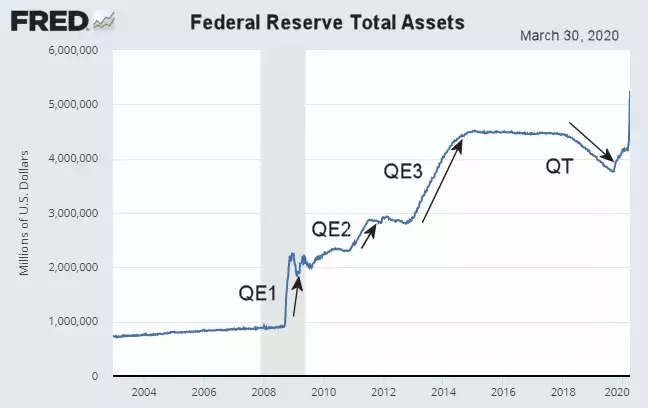
Each time they stopped a QE the sharemarket would drop. In 2018 they tried Quantitative Tightening and we saw the 20% correction of the sharemarket that saw them reverse face with notQE for the REPO market where the arrow is pointing above.
So the perspective piece is it took nearly a century to monetise $800b.
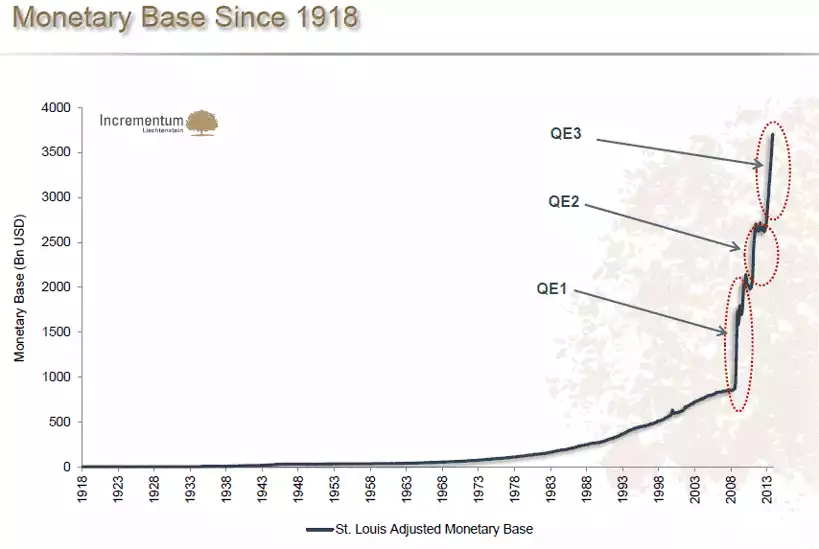
Over the course of the post GFC QE program they expanded that nearly 575% in just 7 years. Note too the kick in the curve around 1973 when we left the gold standard and commenced this epic fiat based credit cycle. Now, in just one month they have created more than 2.5 times what took nearly a century. Before you say that is an unfair comparison as (ironically reinforcing the whole fiat trap) inflation sees today’s money worth much less than 1913’s money, lets look at it against GDP:
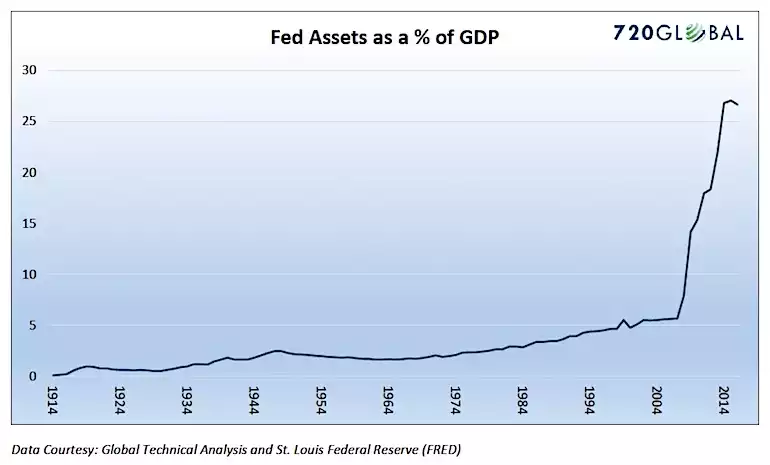
Remember too that over the course of that hyperbolic increase of ‘money’, real money in the form of gold expanded by its usual pace of less than 2% per year….
And it’s not just the Fed of course. The Committee for a Responsible Federal Budget (CRFB) have just released their projections based on currently announced White House initiatives seeing US budget deficits of more than $3.8 trillion this year, another $2.1 trillion in 2021, and totalling over $11 trillion between now and the end of 2025. That, we remind you, is on top of the $23 trillion already there, a near 50% increase.

There are 2 clear takeaways investors need to remind themselves of. Firstly, how, on any sensible level, can such a parabolic expansion of monetary supply not eventually play out in equally parabolic inflation? Secondly look at what happened previously when the stimulus was removed from the patient. Amid projections of massive unemployment and an economic recession shares have been trending UP due only to all this stimulus without any forethought of said stimulus inevitably having to end.
We started today talking about perspective and the relativity of things. Whilst shares have come off and gold has rallied we are still well away from historical highs or even a mean.
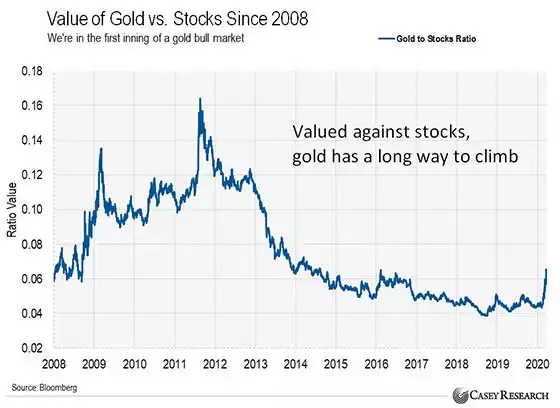
With the fundamental weakness of the economy and what that means to earnings against the fundamental debasement of currencies combined with the inevitable flight to the safety of gold you can see this chart clearly has massive upside potential.