A Critical Time for Crypto
News
|
Posted 11/01/2022
|
5996
With onchain indicators hitting significantly oversold conditions, Bitcoin futures markets see all-time-high leverage, with increased chances of volatility, and a short squeeze bias.
Bitcoin holders were faced with six consecutive red daily candles this week as the broader market sell-off occurred following increased concerns of hawkish policy from the Federal Reserve. Following the release of December's Federal Open Market Committee meeting minutes early in the week, markets reacted to notes related to an accelerated pace of tapering, rate hikes, and potential quantitative tightening to lighten the central bank's balance sheet.
After opening at $47,875 US, Bitcoin led global declines, trading down as much as -15% year-to-date. Prices have since closed the first full week of 2022 at $40,672, putting the bulls on the back-foot to start the year.
The significant factors in the crypto market at the moment are:
• The climate of older coin spending on-chain,
• Increasingly elevated levels of Open Interest in futures markets,
• The potential of a near-term short squeeze developing, as prices trade lower, and bear conviction chases the market down.
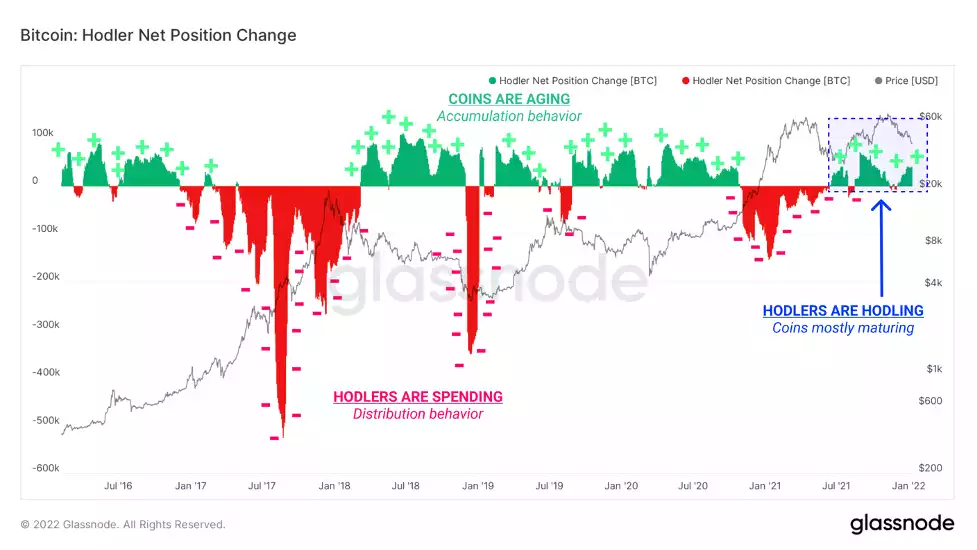
A phase of heavy loss realisation by top buyers has followed the December 4 flush-out. In the weeks since, onchain behaviour has been more heavily dominated by the HODLer class, with little activity by newer market entrants.
One way to see this dynamic is through Hodler Net Position Change, which is the rolling 30-day change in coin maturation. As units of BTC age and mature in investor wallets, they accrue Coin Days, which are 'destroyed' upon spending and help to produce various lifespan metrics.
However, a key difference between these two events can be seen in Exchange Net Flows and the impact on overall exchange balances. In May-July, exchanges saw an enormous influx of some +168k BTC on net over three months. In the current Oct-Dec correction, we have seen a total of 49k BTC flow out of exchanges, making for quite the contrast. The Net Flow Volumes shows that we can see that the current market is firmly in a regime of net outflows, with 3k to 5k BTC in daily outflows common. Overall, whilst significant losses are most certainly being realised on-chain, they are being met with a significant, and arguably overwhelming demand.
We can also look to market momentum using the 28-day Market Realised Gradient (MRG). This tool measures the relative momentum between price action (Market Cap) and capital flows onchain (Realised Cap). High or descending values have historically provided a signal to take caution, and low or ascending values have historically provided a signal for a more risk-on approach.
Current MRG values display Bitcoin as being in an oversold state, with historically low MRG values. However, the metric has yet to fully level out and plateau, indicating that price and capital flows are both still attempting to re-establish a healthy level.
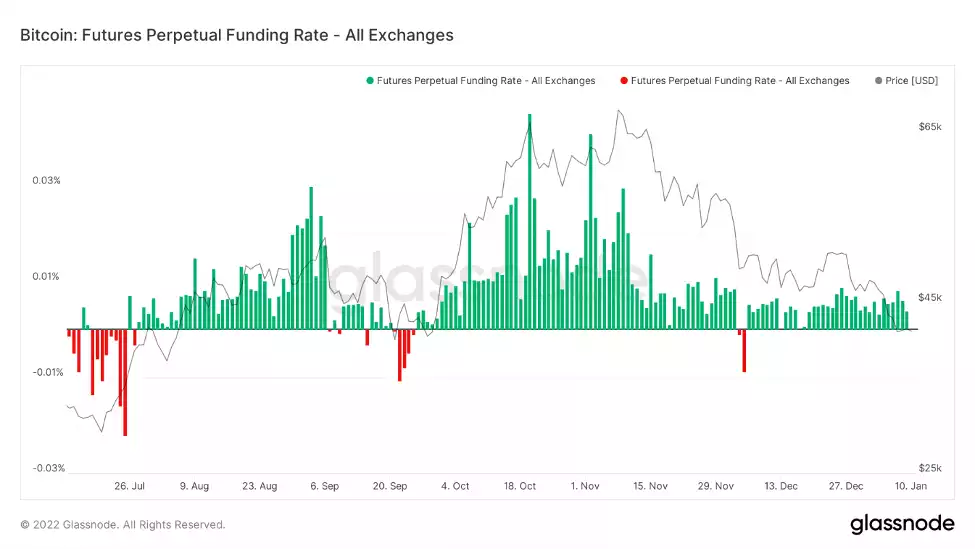
Perpetual futures funding rates are a core data point for assessing the market directional bias. Funding Rates help peg the price of these futures as closely to the spot Bitcoin price as possible by:
• Making longs pay shorts (green) when Perpetual Futures price > spot price
• Making shorts pay longs (red) when spot price > Perpetual Futures price
Extreme values in Funding Rates have historically signalled peak euphoria, or misery for market participants, often correlating with local market highs and lows, respectively. Before the drawdown last week, we witnessed a local euphoria, evident in the large relative spike in Funding Rates, almost precisely at the market ATH. At the lows of the week, we experienced the opposite, with the first negative print since the $40k lows in October.
While some of this is due to the deleveraging event that took place, two things are worth considering:
• Leveraged traders were forced to close their positions, clearing out stop-losses and liquidation levels down to $45k (and even lower on some exchanges).
• Funding rates are only slightly positive at present and are not climbing significantly. This adds further evidence that a large majority of 'excessive' leverage has been cleared from the market. Like Open Interest, this is a metric worth keeping an eye on.
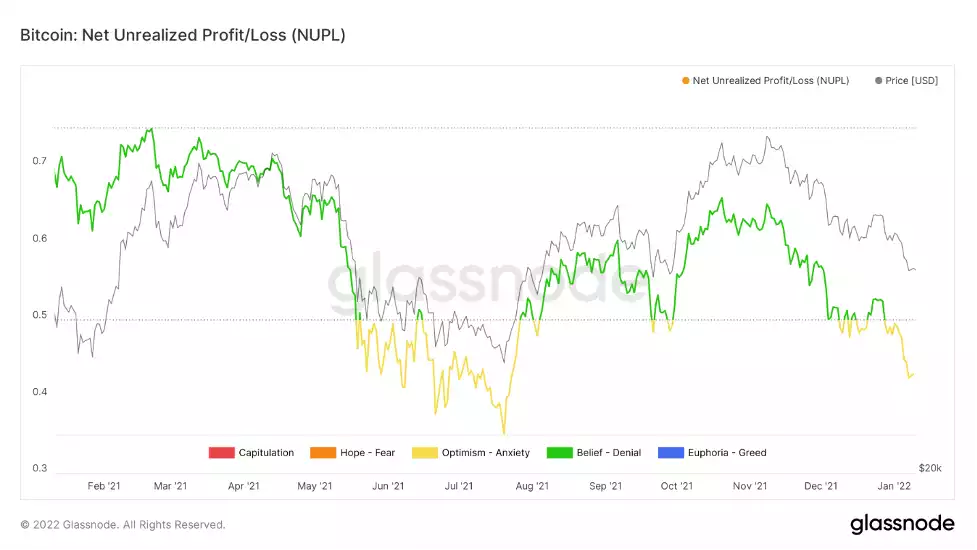
Finally, we will close out with investor profitability. We can use Net Unrealised Profit/Loss (NUPL) as a gauge for when additional sell-side may be activated should Bitcoin prices languish, or decline further. The historical battleground for bulls and bears sits at network-wide profitability of 50%, meaning half of the Bitcoin Market Cap is held as unrealised profit.
• In bear trends, this zone provides resistance, as holders are increasingly willing to cut their positions at a moderate profit, as can be seen in the May to July price action.
• In bull trends, this zone provides support from holders looking to add to their profitable positions, as can be seen through August to November.
Per the chart below, the current leg down in price seems to resemble a correction within a larger bull trend - a stark contrast to May where NUPL sliced cleanly through the 50% level. However, the transition between this area marks the difference between Belief-denial (green colouration) and Optimism-Anxiety (yellow colouration), an appropriate description for current holder sentiment at present.
As the Bitcoin market consolidates, it appears that derivatives markets have taken more of a back-seat relative to spot markets, and a meaningful deleveraging event has occurred. There are signs conviction is returning to spot investors and demand remains significant, however, the market still sits atop a key level of psychological support as seen in the NUPL metric. This trading range may be defining the bull-bear line in the sand, and a key risk is whether a possible transition into less favourable conditions occurs should it fail to hold.
In summary, the current Bitcoin market structure can be best described as having a mild demand for spot, with the majority of onchain metrics describing a dominance of HODLers in accumulation, typical of bearish markets with low retail/tourist interest. It certainly is a critical time for the crypto markets!