“Bad Breadth” – Why FANGover matters
News
|
Posted 31/07/2018
|
7182
After yet another heavy night of falls on the NASDAQ tech index more and more economists and market talk about ‘breadth’ and ‘momentum’ and ‘growth’ is raising its head. The concerns being expressed across the board this last week is around a market heavily weighted to tech stocks and in particular FANG (Facebook, Amazon, Netflix and Google). That lack of breadth is exacerbated by clear dynamics around ‘momentum’ and ‘growth’ where investors are piling in purely on the trajectory of price growth despite the ‘value’ part of the growth/value dynamic not present. i.e. it’s a ‘sheeple’ play of the herd mentality thinking somehow ‘this time is different’, you know, like 1999…
For context let’s just revisit how heavy that dominance is. From DataTrekResearch:
“The central problem here is simple math:
- The Tech sector is 26.2% of the S&P 500.
- Five names represent 15.5% of the index: Apple (4.0% weight), Microsoft (3.5%), Google/Alphabet (3.2%), Amazon (3.0%), and Facebook (1.8%).
- The same 5 names are 7.9% of the MSCI World Index, greater than the allocation for all Japanese equities (7.5%).”
That’s pretty heavy. For further context let’s look at how reliant global shares have been on that tech sector since it properly emerged in 1995.
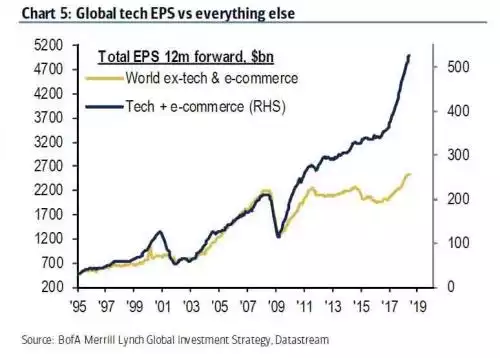
Looking at the above chart, zoom in on 1999 to 2000 for the last disconnect. Is this time really different?
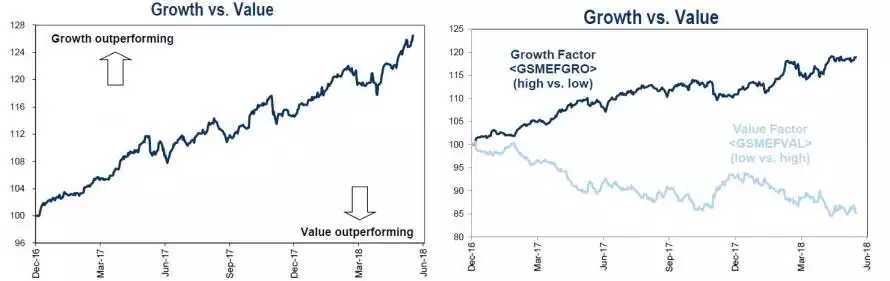
The move into the momentum play of tech stocks started again in earnest after the rout in 2016…
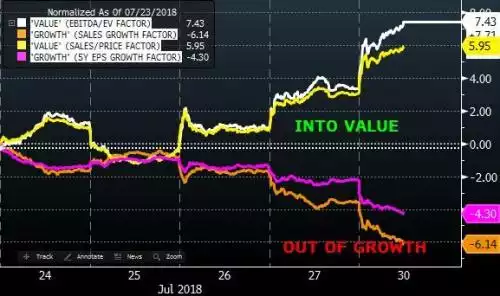
But this last week has seen a sudden reversal of that trend:
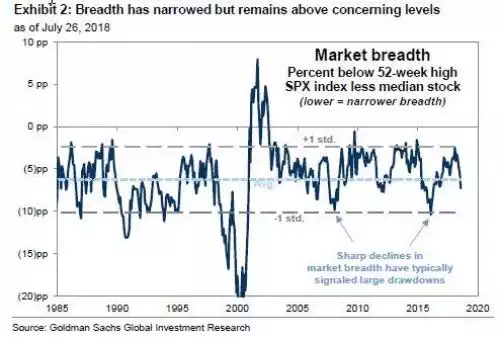
This is a concern when you consider the breadth part of the equation. As Goldman Sachs put it:
"the top 10 contributors have accounted for 62% of the S&P 500 7% YTD return…Of these 10 stocks, nine are technology or internet firms. The Technology sector alone accounts for 56% of the S&P 500 YTD return (76% including Consumer Discretionary members AMZN and NFLX).”
Goldmans have 2 measures of breadth, their own proprietary index which just turned to 0 out of 10:
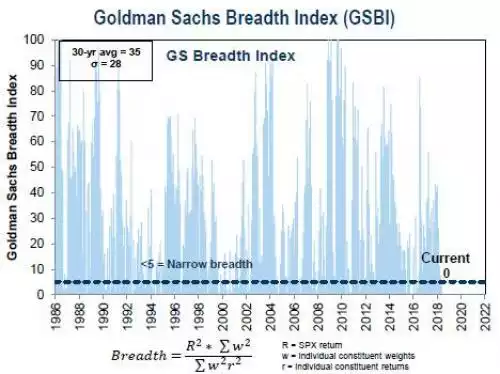
And the Market Breadth index:
And it’s not just a tech thing but a broader concentration of companies per se:
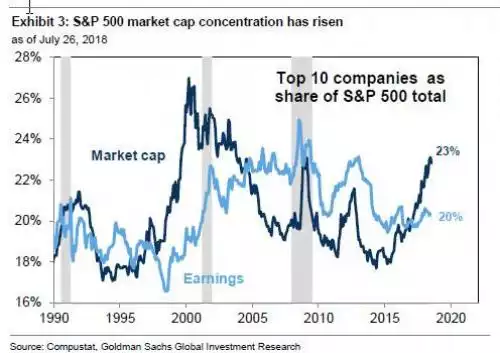
Now go back and have a look at each of the 3 charts above and the previous crash & recessions of 2000 and 2008, and previous market corrections of 2011 and 2016.
There is a very good reason why it is said the 4 most expensive words in investing are ‘this time if different’.