$8,000 Gold Forecast on “Big Picture”
News
|
Posted 30/08/2019
|
11221
AG Thorson is a respected technical research analyst and accredited CMT with his subscription based GoldPredict.com. After correctly calling this rally mid this year he has now published another forecast that is certainly catching people’s attention in predicting $8000 gold in this bull market as he steps back and looks at the bigger picture.
“With gold confirming a new bull market, it's time to step back and look at the big picture. Using technical analysis, I'll provide potential price objectives for the next decade.
It seems each decade has an investment theme that favors one asset class over another. What performed well over the last decade generally underperforms during the next.
During the 1990s, the stock market was the place to be. An explosion in Internet stocks led to the dot.com bubble. The Nasdaq rallied from 330 in 1990 to 5100 by 2000.
During the 2000s, precious metals and commodities were the best performing assets. Gold rallied from a low of $255 in 2001 to $1923 by 2011.
During the 2010s, money flows switched back to the stock market. The DOW bottomed at 6469 in 2009 and prices reached 27,400 in July 2019.
Of course, it's impossible to get in at the bottom and out at the top in real-time. The transition period from one assets class to another usually takes a couple of years - the key is recognizing it.
After a 10-year bull market in stocks, it stands to reason another asset shift is unfolding. That combined with the recent breakout in gold leads me to believe the next decade will favor precious metals and commodities (tangible assets).
Technical Outlook and Price Objectives
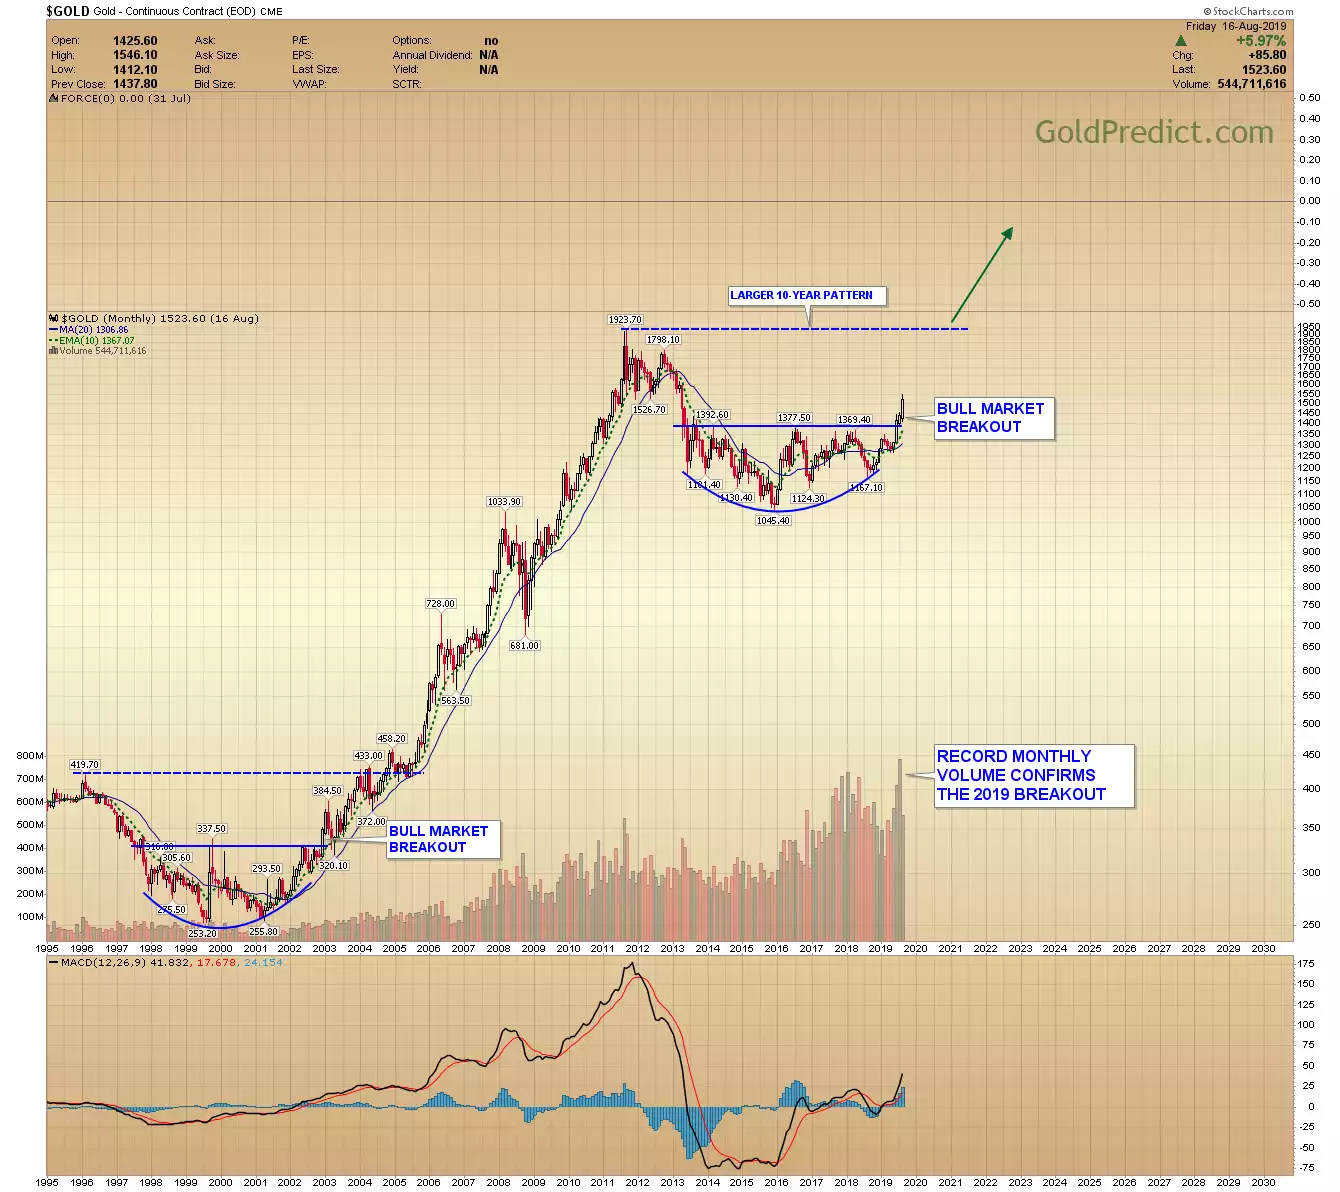
Monthly Gold Chart: Gold broke out of the 6-year basing formation in June when prices closed above $1400. The overall structure is similar to the 1997 - 2003 rounded bottom that generated an 8-year bull run. From here, I suspect gold will work its way higher to finish the larger degree 10-year pattern and breakout to new all-time highs in the next decade.

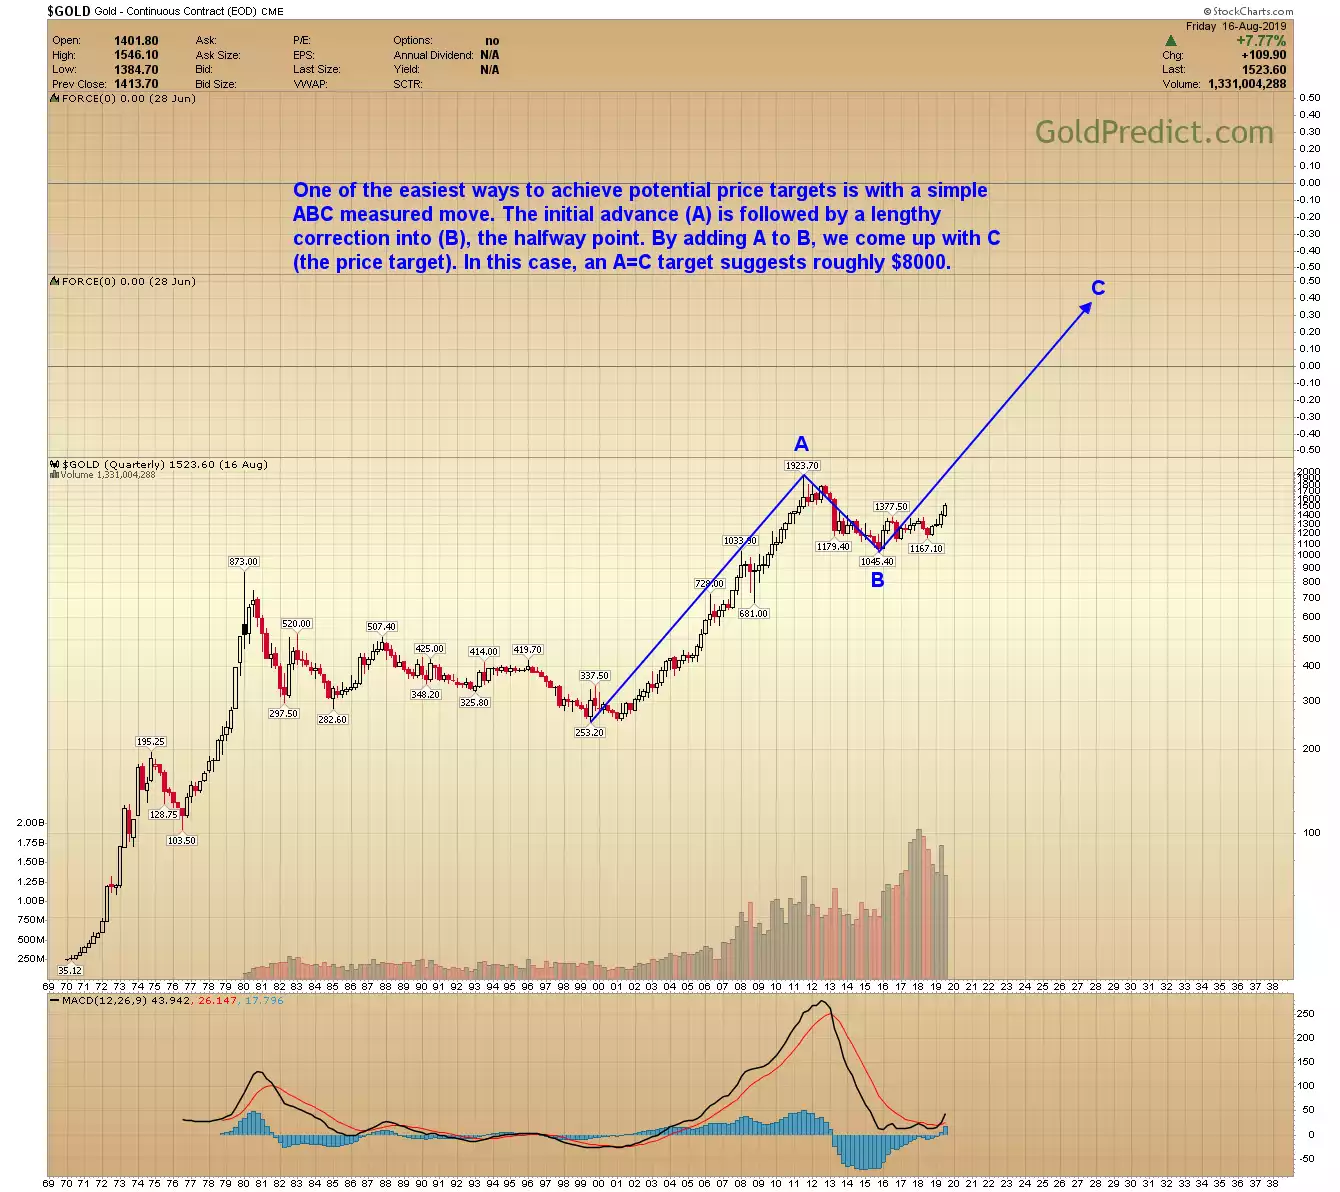
Quarterly Gold Chart: One of the easiest ways to achieve potential price targets is with a simple ABC measured move. The initial advance (A) is followed by a lengthy correction into (B); the halfway point. By adding A to B, we come up with C (the price target). In this case, an A=C target suggests roughly $8000.

An $8000 price target for gold almost sounds ludicrous, I know. But what could cause prices to reach such lofty levels?
A collapse in confidence- A total collapse in confidence in Governments and their ability to manage.
Widespread fear- Governments may resort to debt monetization and currency depreciation to inflate away debt.
Speculation- A surging uptrend and new all-time highs in precious metals leads to the fear of missing out and sparks a speculative bubble.
Will gold reach $8000 during the next decade? Frankly, I have no idea. However, I do see the potential for the above ingredients. Whatever the case, I think a new gold bull market is just getting started, and investors should consider some allocation.”