Where Is BTC’s Floor?
News
|
Posted 03/05/2022
|
6661
Bitcoin investors are hanging onto the edge of profitability, with short-term price action threatening to put them back into the red. Meanwhile, a constructive confluence of macro indicators is developing into a clearer picture of a potential bear market floor.
Markets worldwide continue to recoil in the face of inflationary pressures, tightening monetary conditions, and compounding uncertainties and risks. This week saw significant weakness across equities, bonds, and cryptocurrency markets, with Bitcoin trading down to a new monthly low of US$37,614.
Despite trading down this week, Bitcoin markets have remained surprisingly robust, on a relative basis. Whilst the S&P500 and NASDAQ indexes traded to new local lows of the prevailing bearish trend, Bitcoin prices remain range-bound and continue to lack any definitive macro momentum in either direction. With that said, correlations between Bitcoin and traditional markets remain near all-time highs, and a broader perception of Bitcoin as a risk asset remains a significant headwind.
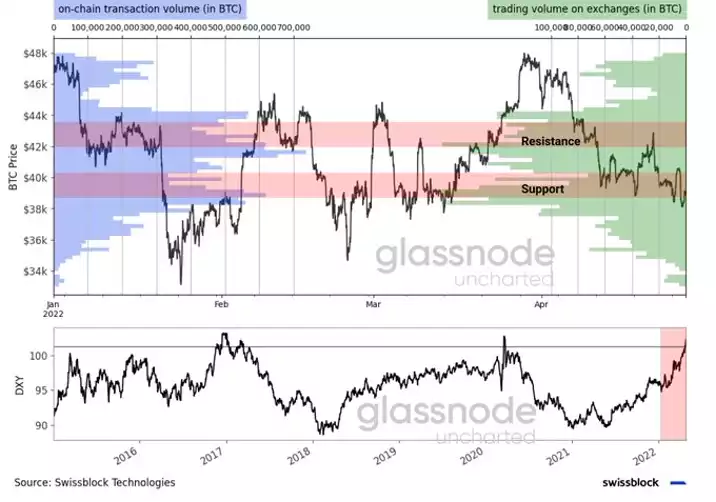
A very large proportion of Bitcoin investors are peering into the abyss of holding unprofitable positions, creating the potential spark for an expected capitulation event. Simultaneously, however, numerous long term macro indicators are signalling historical undervaluation levels are in play, reaching values rarely seen outside late-stage bear market floors. For example, many are looking at whether the DXY will break above its resistance level and could thrust bitcoin over to the $42k plus channel.
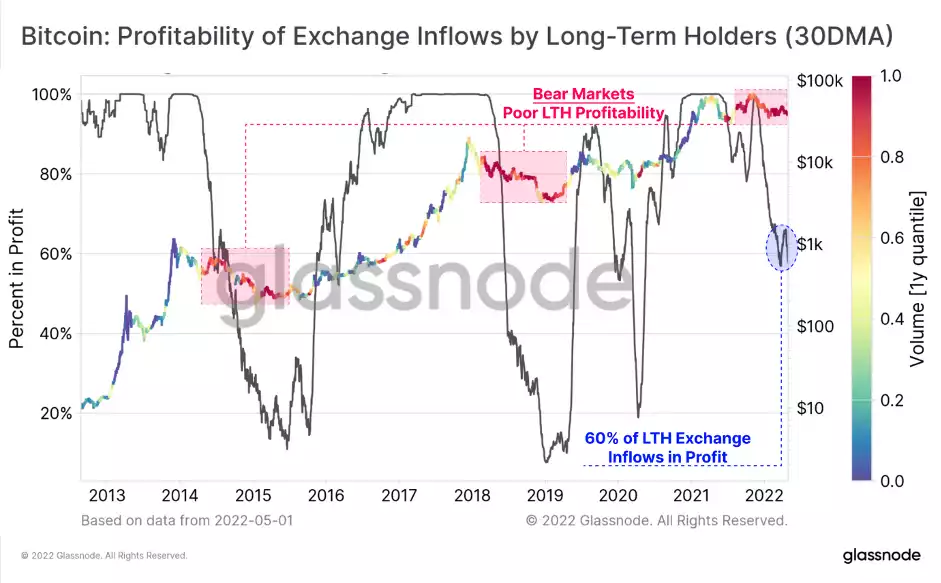
We can characterise LTH spenders, and narrow the typical age range of their coins using a variety of on-chain tools to gain a perspective of cohort spending:
- Oscillator (grey, 30DMA) showing the proportion of BTC volume sent to exchanges by Long-Term Holders that are in profit. We can see it has declined significantly since September 2021 and is now hovering around 60% (adding weight to our previous pain threshold estimate).
- Price chart coloured by raw profitability relative to the last year, with red signalling high relative losses, and green/blue signalling heavy relative profits. The bear markets of 2014-15, 2018-19, and 2021-22 become quite apparent, with heavy LTH losses realised for many months.
The only LTHs that could realise losses and trigger this result are those from the 2021-22 cycle with a higher cost basis, suggesting they dominate LTH spending behaviour into exchange at present.
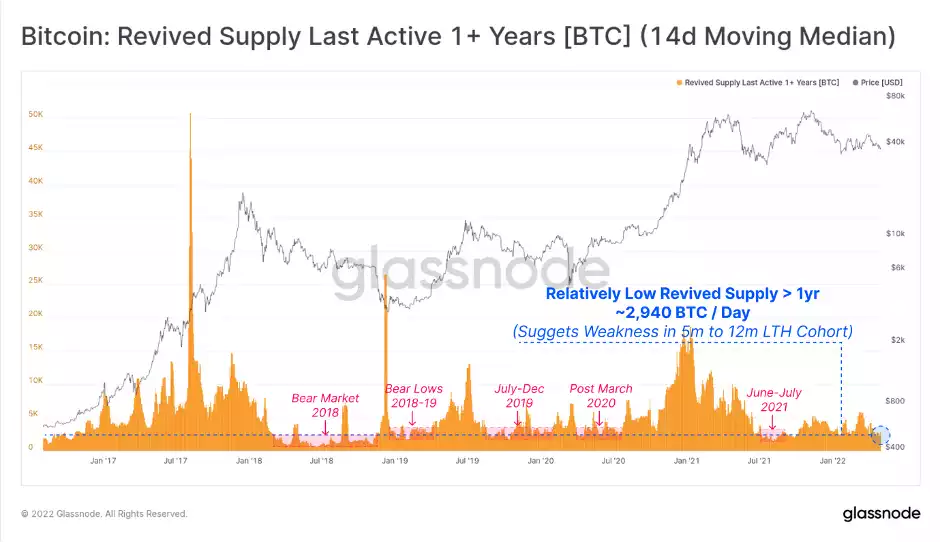
We can also see that the Revived Supply metric is declining and is near relative lows. Usually, very low readings of revived supply occur in deep bear markets where accumulation is the preferred behaviour of LTHs.
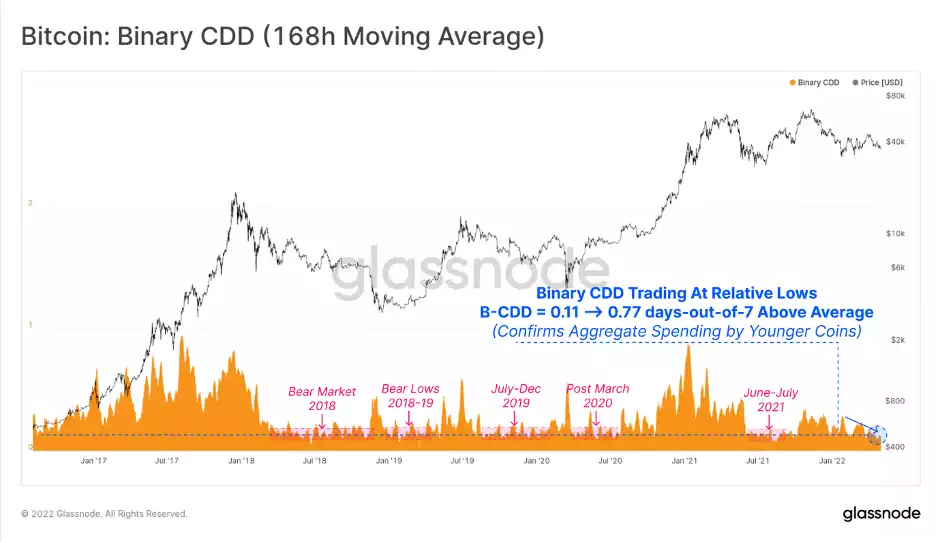
Binary Coin-days Destroyed largely supports this observation, with a near-identical trend and notable markers. On a 7-day average basis (at hourly resolution), this metric is indicating that 18.5 hours out of each week are seeing greater than average lifespan destruction. In other words, 89% of the time, owners of older coins are choosing to keep them dormant, and are not contributing to spending sell-side pressure.
Both of these metrics further support the notion that LTH sell-side pressure at the moment is primarily driven by owners of coins between 155-days, and approximately 12-months (aka 2021-22 buyers).
On-chain tools can provide us with both an assessment of current investor behaviour, but also with fundamental valuation tools to help us map out and navigate various market cycles.
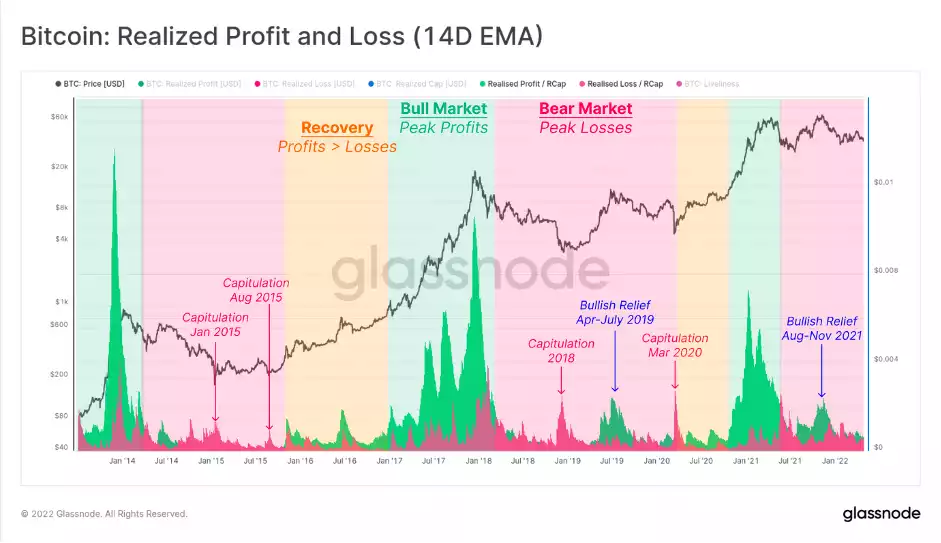
The chart below is a variant of Realised Profit (green) and Loss (pink), calculated by dividing each by the Realised Cap. This effectively normalises the USD value investors bring in/out of the market, to the relative market size, enabling us to compare cycles. From this we can broadly identify three market phases:
- Bull Markets (green zone), where sufficient inflow of demand exists to allow investors to realise significant profits, right into the market cycle top (net capital inflows).
- Bear Markets (red zone), where the converse is true, and declining prices result in a dominance of losses being realised by investors (net capital outflows). In 2019 and arguably late 2021, we saw profits taken into a brief bullish relief rally, that was ultimately sold into.
- Disbelief Recovery to Early Bull (orange zone), where the market trades sideways to upwards, typical of a re-accumulation period or disbelief phase, and realised profits start to exceed losses consistently.
In the current market, we remain within the Bear Market phase, where the market is yet to provide sufficient demand and price appreciation to enable sustainable profit-taking and capital inflow. Should realised profits begin to outpace losses on a sustained basis, alongside stable prices, it may suggest a transition to Phase 3 is underway.
To summarise, the current market structure for Bitcoin remains in an extremely delicate equilibrium, with short-term price action and network profitability leaning bearish, whilst long-term trends remain constructive. The capitulation of Long-Term Holders appears to. be continuing, with further evidence and analytical colour added to this concept this week.
Whether macro forces and correlations with traditional markets drag Bitcoin lower remains to be seen, however, numerous fundamental indicators are at or approaching noteworthy points of undervaluation. There is a constructive confluence across numerous macro indicators, ranging from technical analysis (Mayer Multiple), to coin lifespan analysis (Reserve Risk, VDD Multiple), and even fundamental network health and utilisation (RVT Ratio).
A capitulation event, alongside developing divergences in short- and long-term trends continues to make Bitcoin one of the most fascinating assets to monitor within this macroeconomic environment.