What’s On the Horizon for Crypto?
News
|
Posted 22/03/2022
|
6370
Bitcoin markets have seen another week of low volatility and price consolidation, trading up from $37,680 US and towards the range high of $42,312 over the weekend. As prices trade within this narrow range, the odds of higher volatility in the near-term build.
In a nutshell, we are seeing the following factors driving the crypto market at the moment.
- Current buy-side demand appears to be dominated by US and EU markets, with the majority of sell-side sources during Asian trading hours.
- The amount of BTC supply absorbed during the current drawdown is similar in magnitude to the period after the March 2020 sell-off. However, it remains modest at best and is a key metric to keep an eye on in the coming weeks.
- Derivatives markets are currently pricing in historically low implied volatility, and futures premiums. Such market structure has historically preceded periods of very high volatility, and most often to the upside.
The rangebound price action has also correlated with onchain recovery.
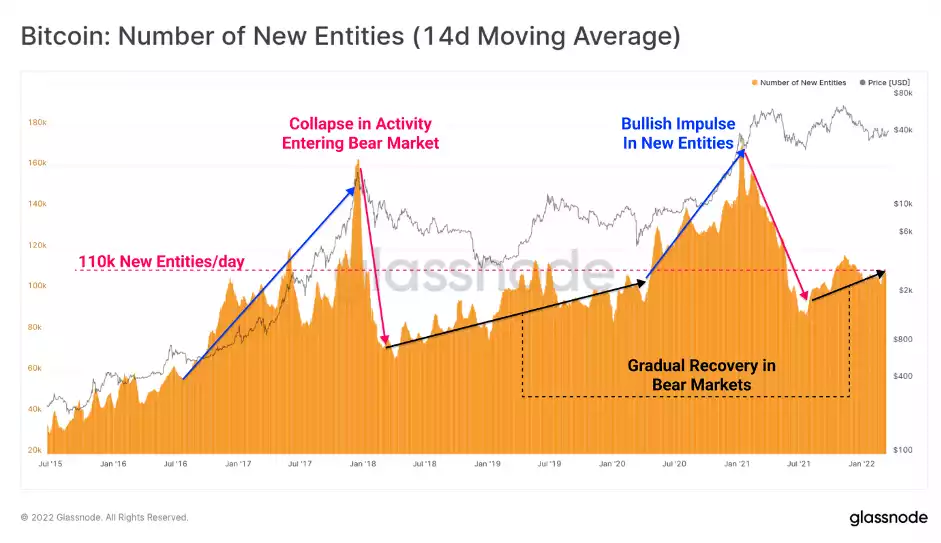
A useful tool-set for tracking Bitcoin demand is the analysis of on-chain activity, ranging from active addresses, new on-chain entities, transaction counts, and transfer volumes. Typically, we see these style activity metrics collapse during early bear markets and begin to signal recovery as smart-money demand increases at depressed prices.
We can see the accelerated growth rate in new on-chain entities a bull (blue), followed by a heavy collapse at the start of a bear (pink). Bear markets are characterised by a fairly persistent grind higher in new entities entering the Bitcoin network.
The current rate of 110k new on-chain entities per day is similar to the peak of the 2019 mini-bull and is on a modest upwards trajectory.
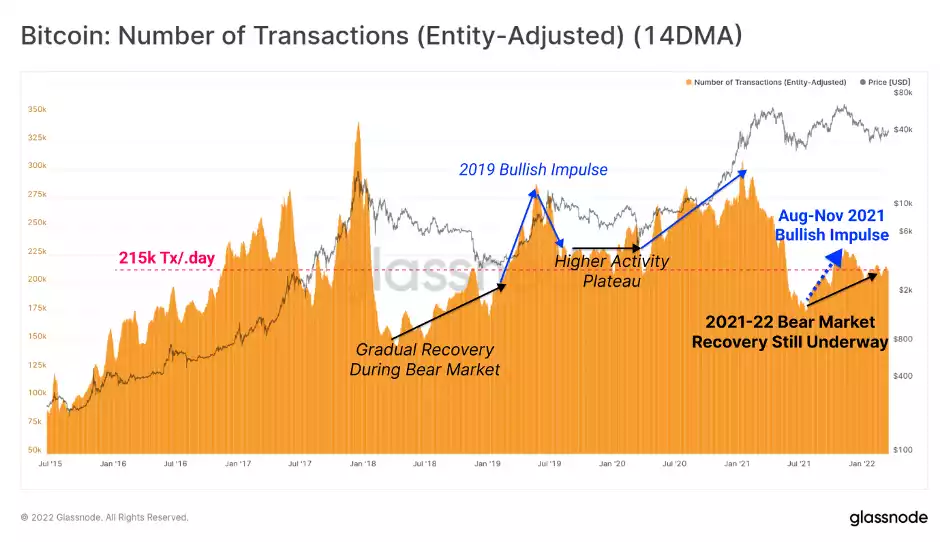
A similar trend is observable in transaction counts, although the current rate of 215k Tx/day is lower than what was observed throughout 2019.
For metrics like active addresses, new on-chain entities, and transaction counts, an accelerated growth rate higher would be a constructive signal and likely support a healthy recovery in prices. Conversely, a deterioration in network utilisation would be a more bearish observation, and one to watch out for as a sign of demand exhaustion.
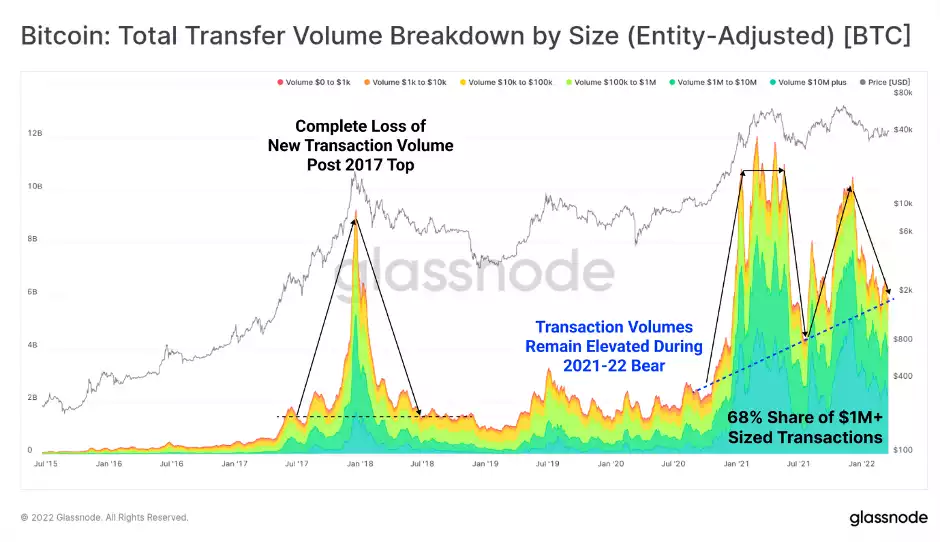
One piece of data that is not captured by the analysis of active addresses/entities and transaction counts is the economic weight of these network users. Where the general characteristics of the above metrics are similar to the 2019-20 bear market recovery, transaction volumes and value settlement are notably different.
The 2017 bull market top was followed by a near-complete 'destruction' of the new transaction volume that pushed prices to the cycle all-time-high of $20k. Throughout 2018 and 2019, daily settlement volume languished at around $1.5B/day, a level first established in July 2017. Large size transactions (>$1M in value) represented between 10% and 30% of all volume at this time.
In the 2021-22 bear market, however, total daily value settlement has continued to trend higher, as measured at the lows of both 50%+ draw-downs. Large size transactions also now represent a sustained 65% to 70% dominance.
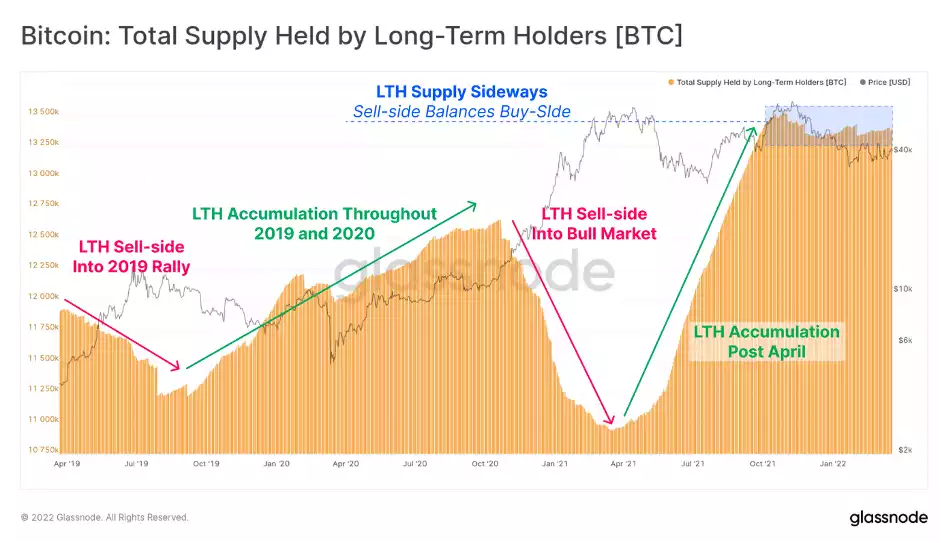
The current drawdown has now been in play for 132-days since the Nov ATH, and the tail of our 155-day threshold used to define Long-Term Holder status is approaching the October price high. As such, we can make a broad assertion that Long-Term Holders own coins before the market high, and Short-Term Holders own coins purchased during or after the market top.
With this in mind, we can see that Long-Term Holder (LTH) supply holdings have stagnated since the October peak. This suggests that the volume of coins maturing into LTH status is being met by equal spending pressure by this cohort.
The Bitcoin market has now been in a drawdown from the November ATH for 132-days, and prices have consolidated inside the present trading range for over 2-months. This has led to a compression of yields available from cash-and-carry trades in futures markets, and lower implied volatility in options markets.
The market spring appears to be coiled, and a period of higher volatility just over the horizon seems increasingly likely.