WGC - Gold Demand Trends Q2 2021
News
|
Posted 02/08/2021
|
5418
The World Gold Council just released their latest quarterly Gold Demand Trends for Q2 2021 which saw a continuation of rampant bar and coin investment demand and a return to inflows into ETF’s. The quarter saw 955 tonne of gold consumed. As usual, we summarise across all uses and look at supply too.
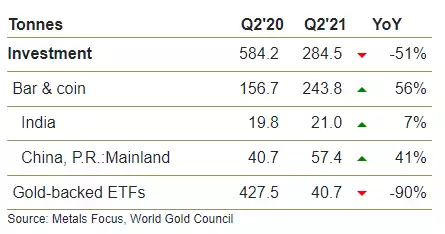
Bar & Coin Investment Demand
Bar and coin investment saw a fourth consecutive quarter of strong year-on-year gains with Q2 demand of 243.8 tonne resulting in a H1 total of 594.t, the strongest half year since 2013. Of that 244 tonne, China accounted for nearly a quarter at 57.3 tonne.

ETF Investment Demand
Modest Q2 inflows into gold-backed ETFs of 40.7 tonne only partly offset the heavy outflows from Q1; consequently, ETFs saw H1 net outflows (of 129.3t) for the first time since 2014.
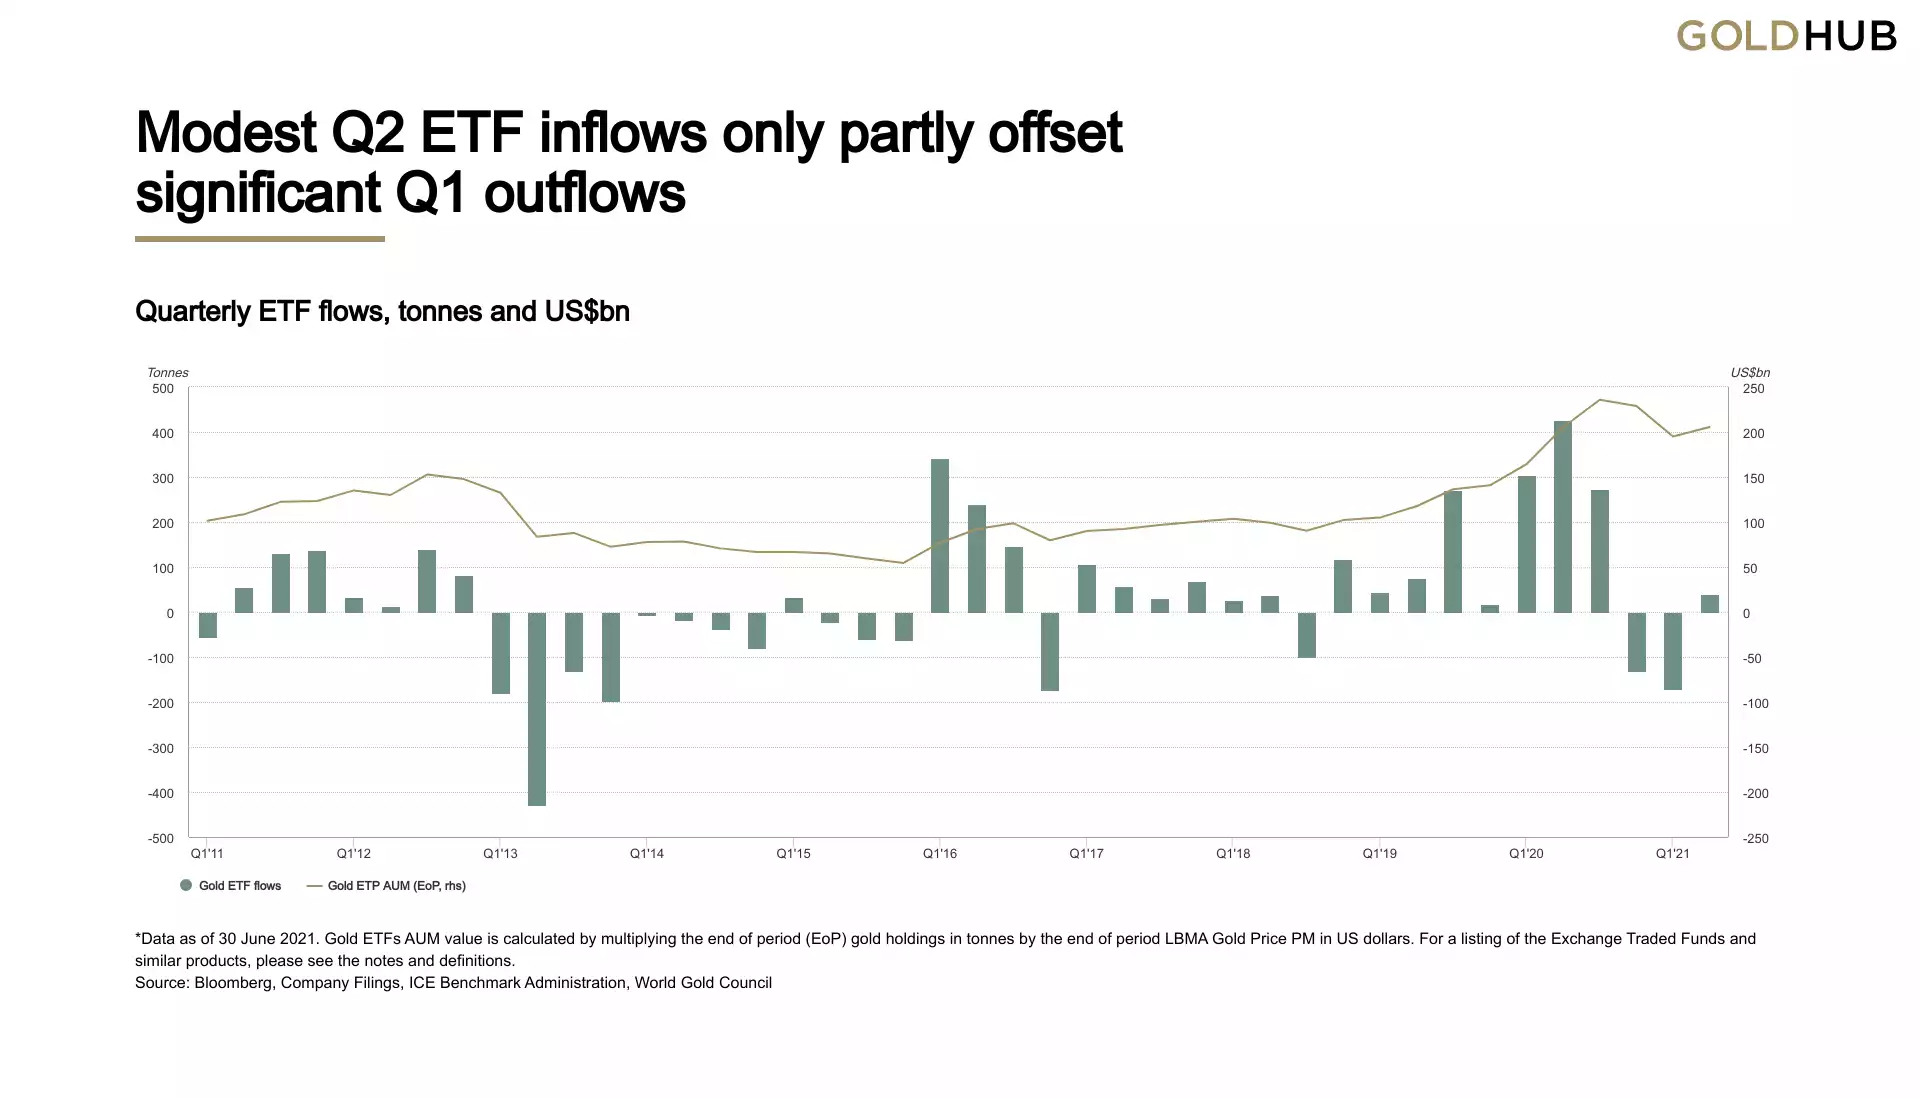
ETF outflows slowed sharply in April, before reversing in May and resulting in the net inflows of 40.7t for the second quarter. These inflows were less than 10% of the huge 427.5t inflows we saw in Q2 2020 and help explain the sharp y-o-y drop in overall investment. The net result for H1 was for outflows of 129.3t, in comparison with record H1 2020 inflows of 731.2t.
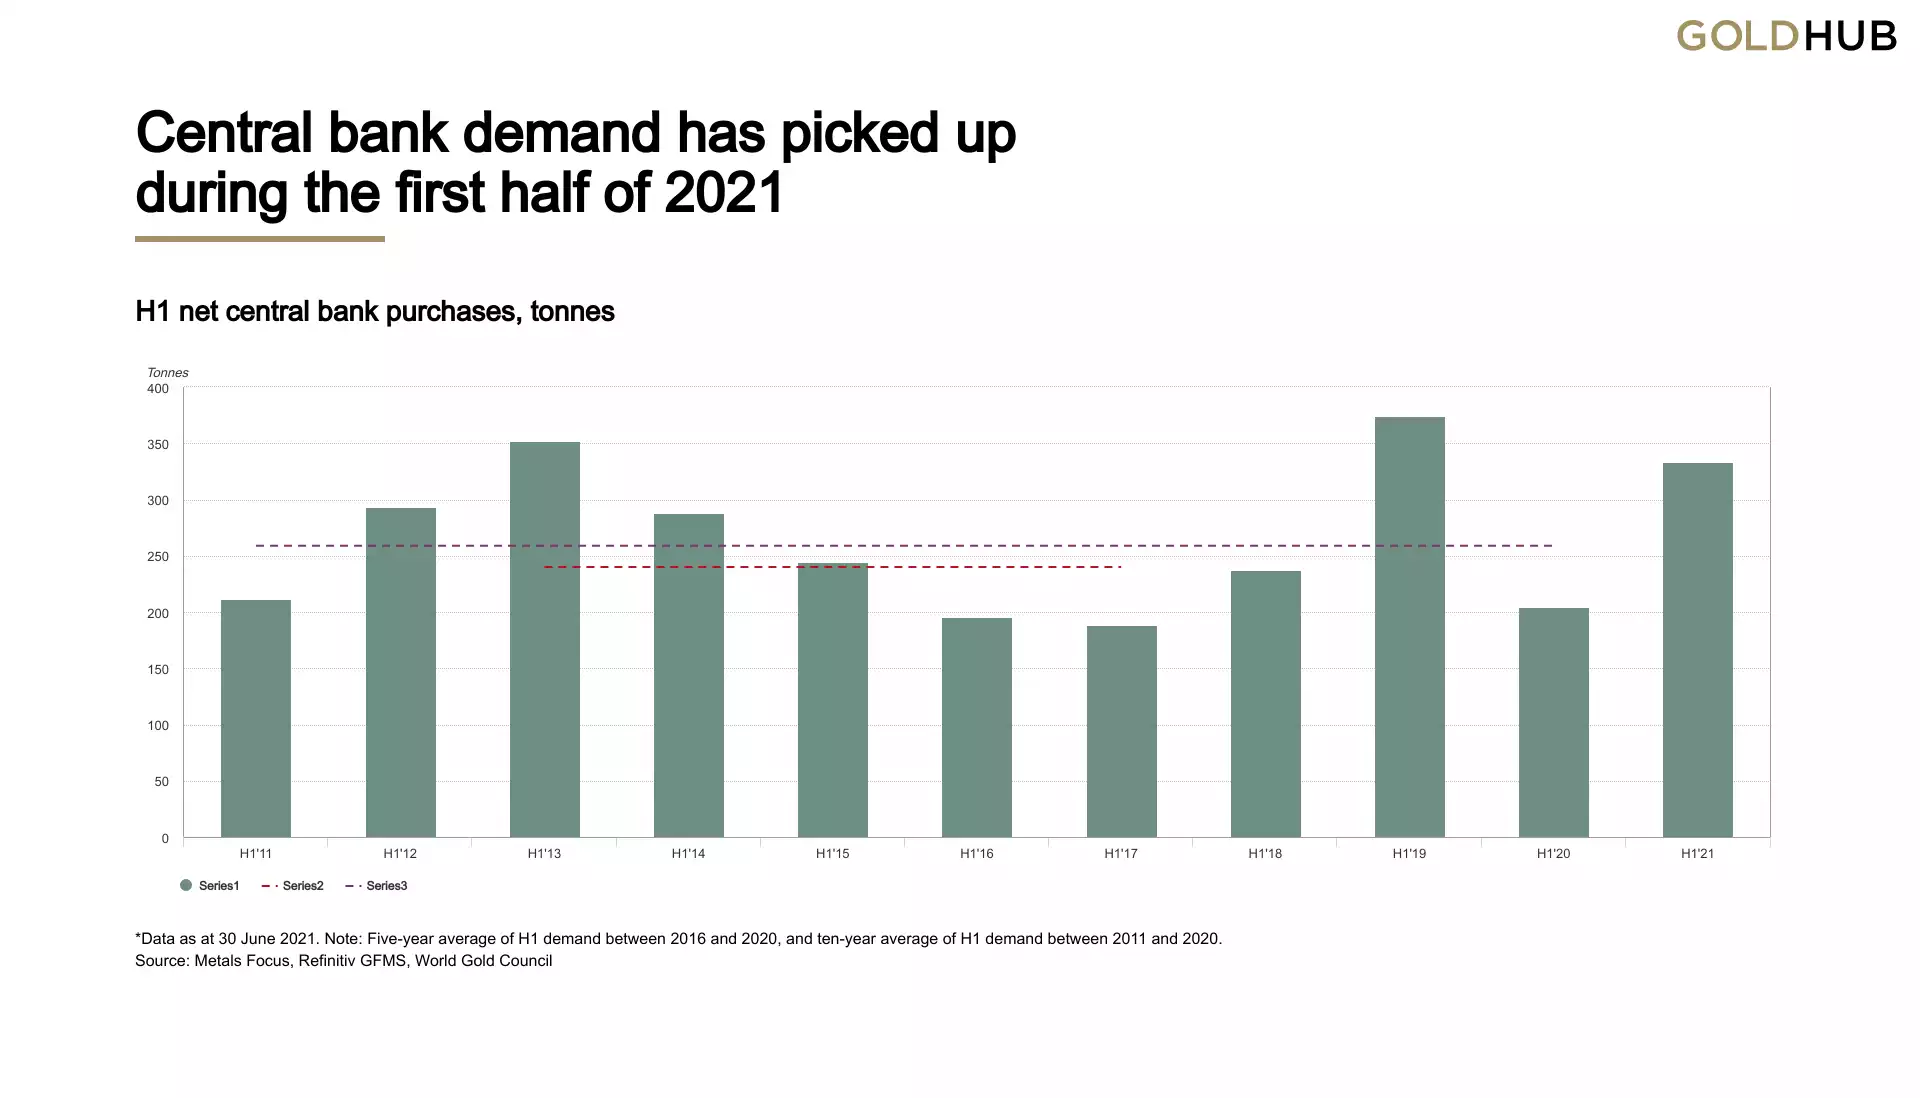
Central Bank Demand
In a third consecutive quarter of net central bank buying, global gold reserves grew by 199.9t in Q2, the highest level of quarterly net purchases since Q2 2019 (227.8t) and 73% above the five-year quarterly average. This brings net buying for H1 to 333.2t, 63% higher than H1 2020, 39% higher than the five-year H1 average, and 29% above the ten-year H1 average.
Having been relatively subdued in the second half of 2020, demand picked up in the first half of 2021, with almost two-thirds concentrated in Q2. Reported gross purchases by the IMF totalled 287.7t over the first six months, with nine central banks accounting for the vast majority of this
Jewellery Demand
Q2 jewellery demand (390.7t) continued to rebound from 2020’s COVID-hit weakness, although remained well below typical pre-pandemic levels, partly due to weaker Indian demand growth. Demand for H1, at 873.7t, was 17% below the 2015-2019 average.

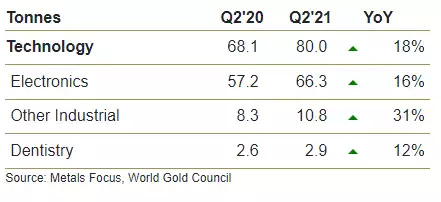
Technology Demand
Gold used in technology continued to recover from the 2020 lows with Q2 demand 18% higher y-o-y at 80t – in line with average Q2 demand from 2015-2019 of 81.8t. H1 demand (161t) was fractionally above that of H1 2019 (160.6t). Electronics rose 16%, memory 3%, LED 15%, wireless 7% and printed circuit boards 8%.
Supply
Gold supply bounced back in H1, up 4% y-o-y to 2,308t as the mining industry experienced much fewer pandemic production stoppages and some underlying production growth was recorded. Mine production increased 9% y-o-y in the first six months of the year. Recycled gold supply fell by 5% y-o-y in H1, despite a higher average gold price – up about 10% y-o-y – as the economic recovery reduced the incentive to recycle gold.