Gold Silver Ratio Hits 20 Year High
News
|
Posted 05/03/2020
|
21107
Gold Silver Ratio Hits 20 Year High
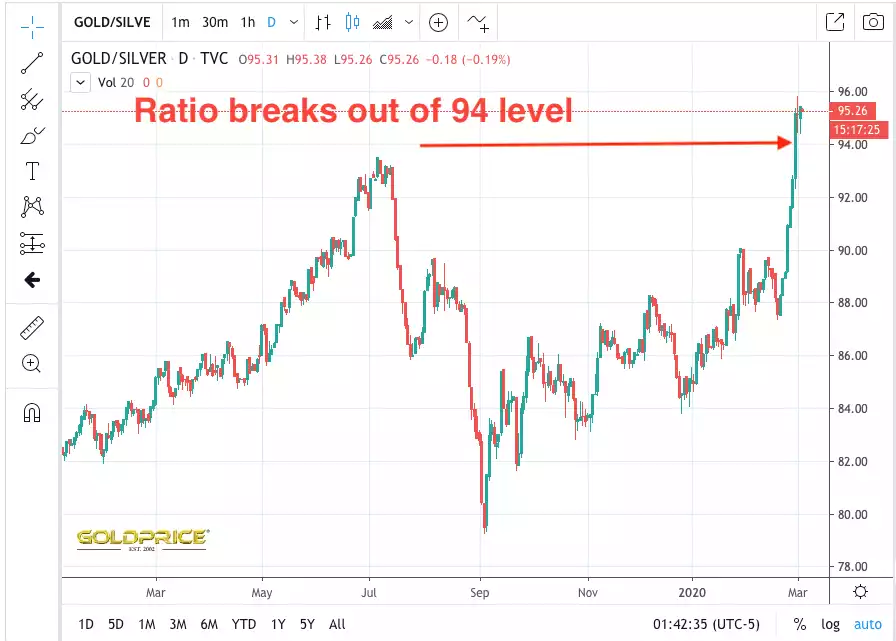
One of the most watched metrics for metal investors is the GSR or Gold Silver Ratio. With gold hitting all time highs in AUD terms and silver languishing we have seen that ratio just hit 95, pushing through the previous century high of 94. As regular readers know, the GSR is cyclical and has formed a mean of around 45 over the last 100 years. If you believe in nothing more than maths and reversion of the mean, a 95 against a 45 mean is pretty alluring. That the reversion process nearly always happens in conjunction with a rising gold price (not the mathematically intuitive falling scenario) makes this all the more exciting for those who hold both metals.
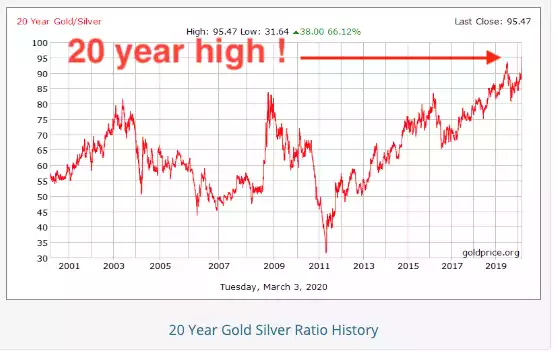
Zooming back looks like the chart below and note when the GSR hit near 30 in 2011, silver reached $48 (now $17) whilst gold was at $1900 (now $1637).
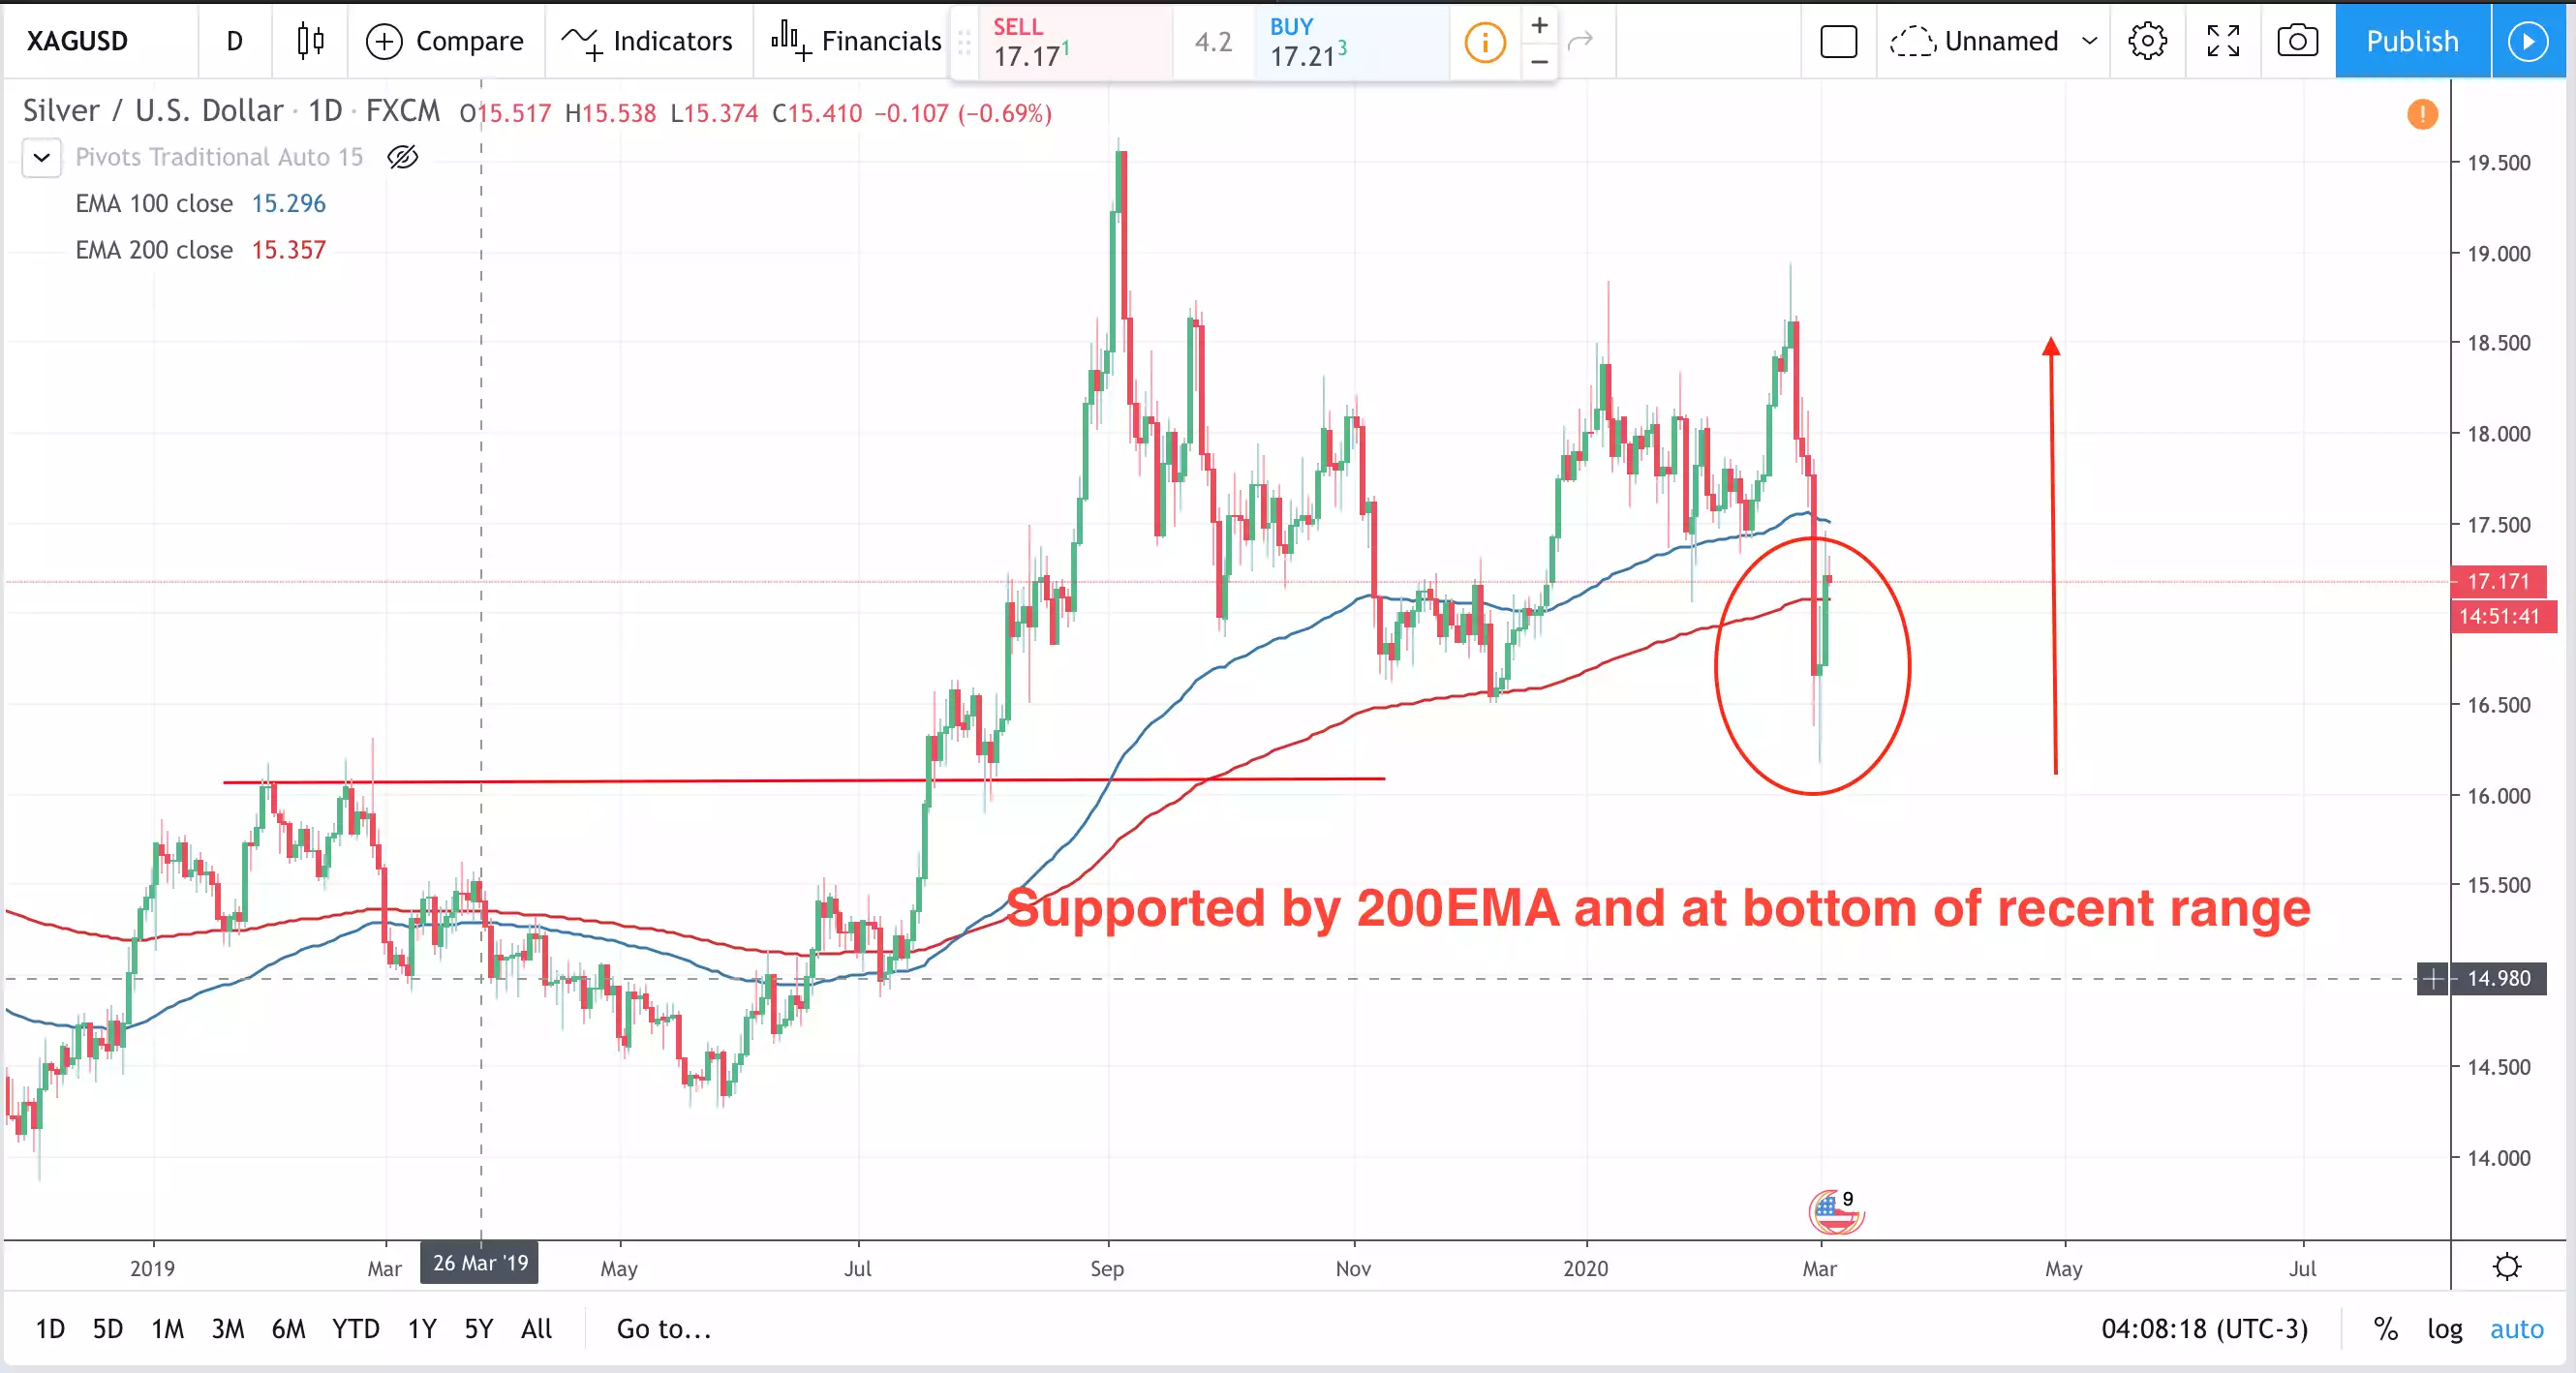
Technically silver briefly broke through its 200EMA (Exponential Moving Average) which if it stayed and in a bearish environment would portend more falls, but its bounce out and in this bullish environment has many tech analysts convinced it’s about to take off.
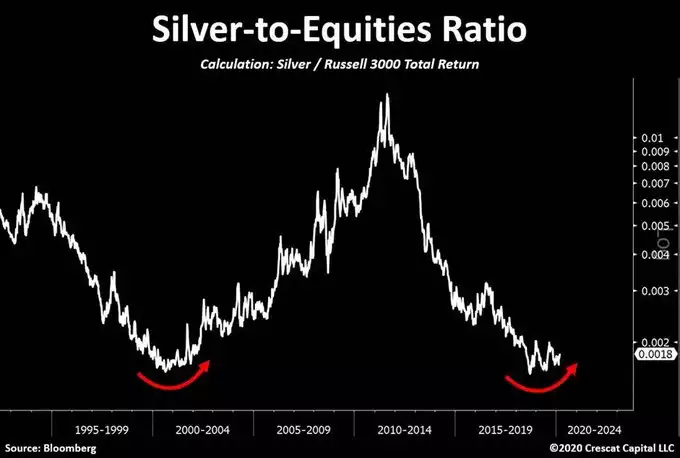
Crescat look at silver relative to (US) shares and that too looks exciting. As Crescat’s Otavio Costa tweeted:
“The battle of two extremes.
Silver-to-Equities now making higher lows after a likely historic double bottom.
The potential for this ratio to rise is tremendous.”
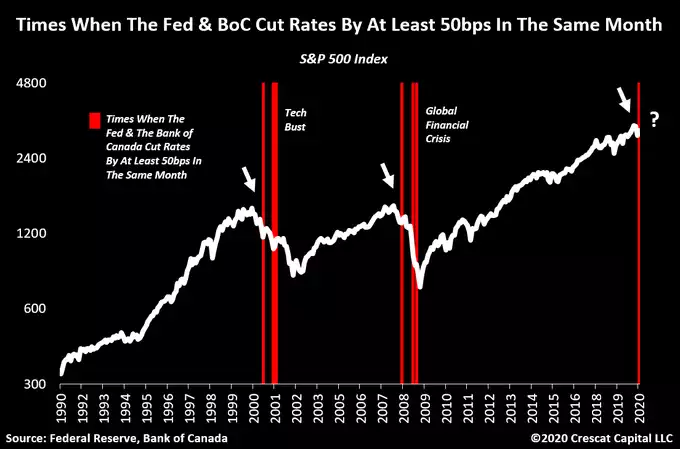
We’ve discussed above the aforementioned “extreme” in the silver component of this chart and the structural upward pressure on silver. In terms of the “extreme” equities the following chart speaks volumes. Yesterday we mentioned that the Fed cut rates by 50pb and only 9th emergency cut in history. The chart below puts that into context against the S&P500 and normalises it with Canada’s BoC doing the same.
So if you like buying low and selling high….