The Final Dip?
News
|
Posted 30/11/2021
|
6571
The market continues to drawdown this week, despite Short- and Long-Term investors holding more profitable supply than the recent correction in September. Bitcoin traded lower this week, alongside weakness across many traditional assets, largely due to renewed concerns over new virus variants. Bitcoin's price opened at a high of $59,339 US and reached the lowest price for the month of $53,569. This continues the price correction that has been in play for most of November.
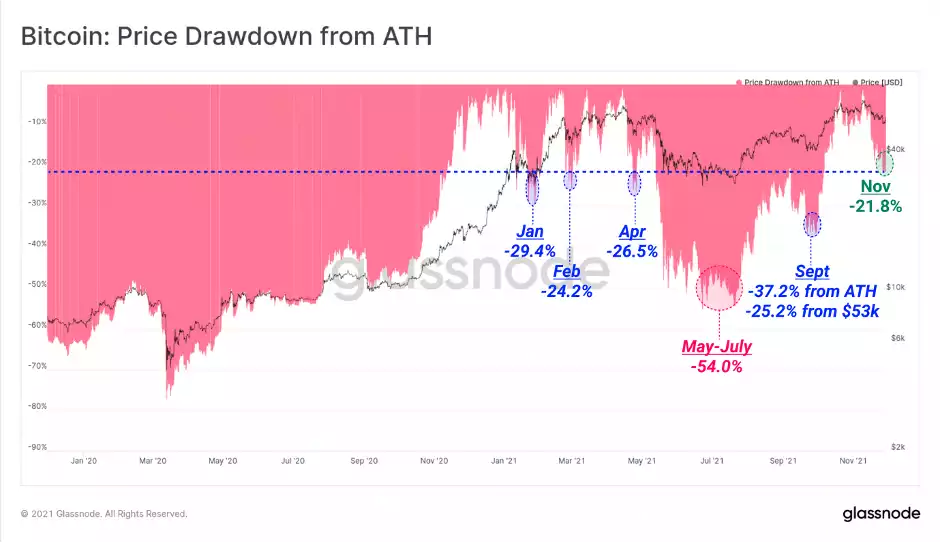
With Bitcoin now over 20% below the all-time-high, headlines in traditional media have declared that Bitcoin has entered a bear market. However, it may surprise some readers that this current market correction is the least severe in 2021. Some might even say business as usual for a Bitcoin HODLer.
Sell-offs in Jan, Feb and April all reached drawdowns as deep as -24.2% from the ATH before reverting. The deepest drawdown this year was the period from May to July, where the market reached a -54% drawdown at the lows. The most recent correction in September was the second deepest, reaching -37.2% from April's ATH, and 25.2% off the local high of $53k.
It is also important to pay attention to the state of Bitcoin derivatives markets, as they can often be a source of excessive leverage which can unwind in a fairly spectacular way from time to time.
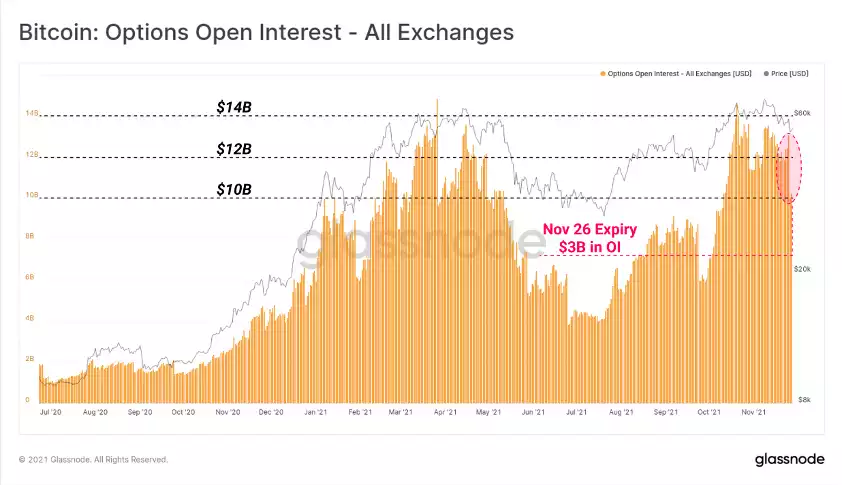
In options markets, we continue to see between $12B and $14B in nominal open interest throughout October and November. The total open interest has come off the highs this week, down to approximately $10 Billion following the expiry of the 26-November contracts.
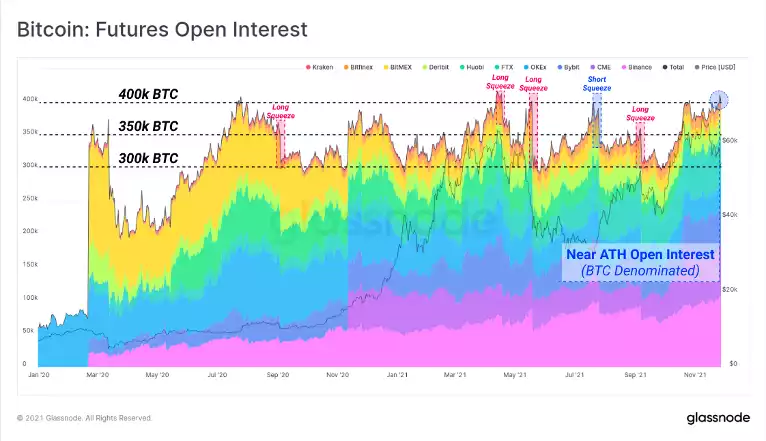
Futures open interest is also just below all-time-highs when denominated in BTC, reaching just above 400k BTC in total nominal value. Denominating in BTC is used to remove the influence of coin price on this metric (such as coin-margined contracts), and aid in identifying periods of rapidly growing leverage, or de-leveraging.
Highlighted in the chart below are several short and long squeezes, where open interest rapidly decreased as price volatility forced traders to cover their positions. With leverage in futures markets near an ATH, there is a risk that leverage may unwind, as has been demonstrated in almost all prior instances where open interest surpassed 350k BTC in size.
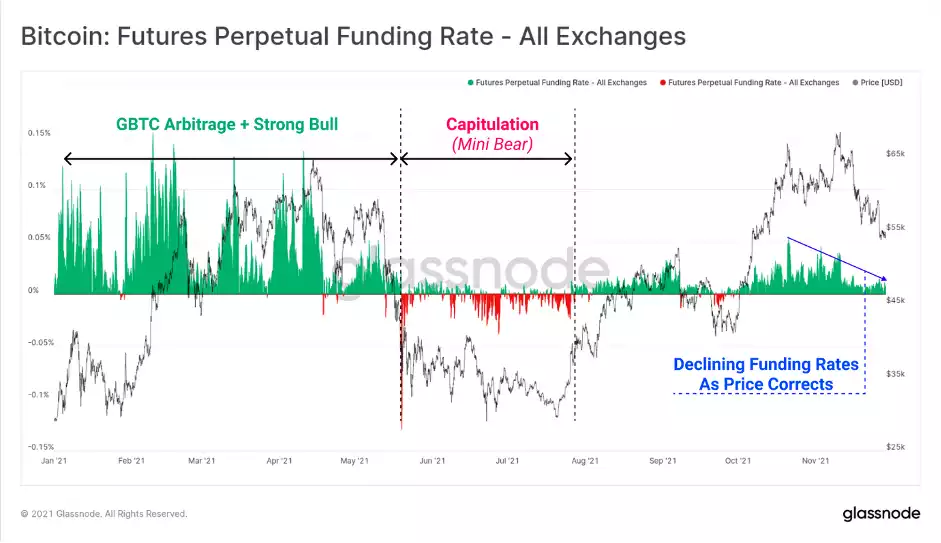
However, for all futures positions, buyers are matched equally with sellers, meaning there is limited information on likely market direction in the event of a leverage squeeze. Perpetual futures funding rates can give some insight into the market's directional bias, and at the time of writing, remains slightly positive (bullish bias). However, it is notable that funding rates have generally declined alongside falling prices, suggesting traders are more cautious as the correction proceeds.
Whilst funding is positive, the decline is quite significant, which doesn't rule out the possibility that a large portion of the market is net short as price declines. It is reasonably plausible for a leverage squeeze to play out in either direction given this observation.
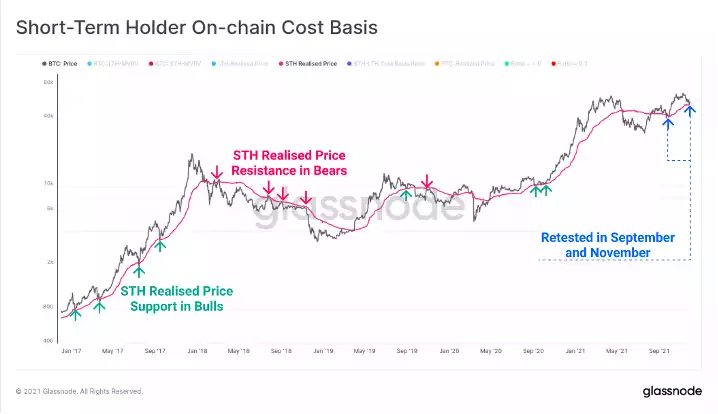
Short-Term Holders are those whose coins are younger than ~155-days. The Realised Price of the Short-Term Holder cohort has been hovering at around $53k, and would likely provide market support.
This week, price traded to a low of $53.5k, suggesting a potential front-running of that psychological cost basis support level was in play. This is now the second retest of the STH Realised Price in the current trend, and if held, has similarities to major corrections observed in 2017, where it acted as a reliable support.
A common onchain behaviour we see near the lows of bull market corrections are top buyers capitulating and realising losses. In many ways, bottoms cannot be hammered out until these potential sellers are exhausted.
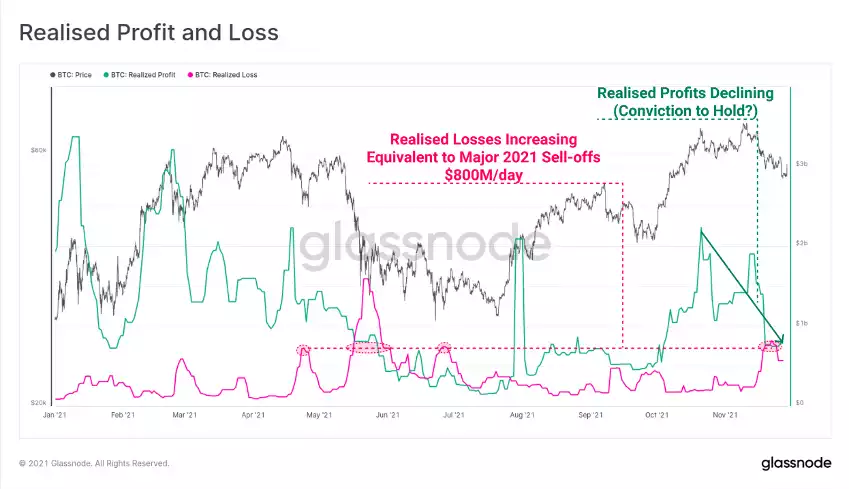
Looking at overall realised profits and losses, we can see two recent events in play:
- Realised Profits (green) have declined alongside the correction, potentially signalling reducing profit-taking, and growing investor conviction.
- Realised Losses spiked (pink) to $800M per day, similar to significant sell-offs in April, and July, but much lower than the major sell-off in May. This suggests a reasonable flush out of spot top buyers has occurred but does not rule out further sell-side.
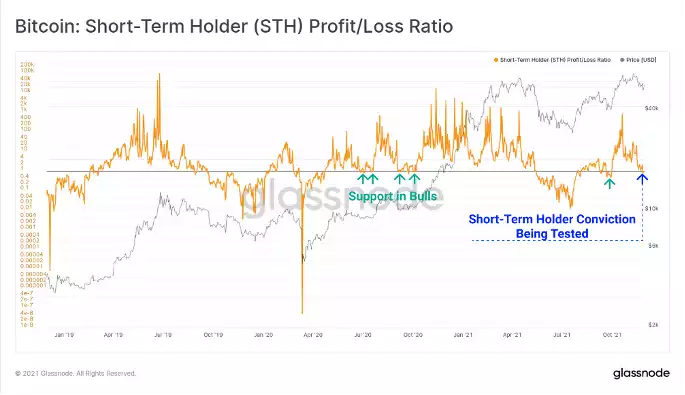
Zooming into the STH cohort specifically, the STH Profit/Loss ratio has fallen just below 1 this week. This indicates that spending by STH are realising losses on net. Similar to the STH Realised Price, this represents a test of investor conviction as prices return to, or below their on-chain cost basis. Ideally, market strength needs to step in reasonably soon, else the probability of STHs selling at or around their cost basis will likely increase.
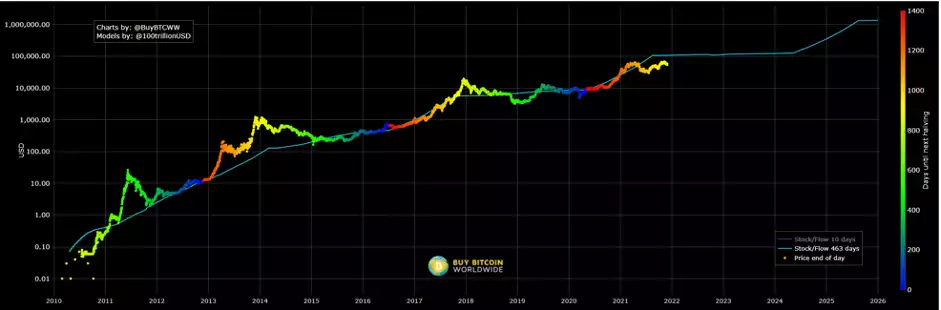
The pseudonymous bitcoin analyst and the creator of the bitcoin price model called stock-to-flow (S2F), Plan B, called the last three months of bitcoin prices correctly but the analyst’s “worst-case scenario” forecast missed the mark in November. Despite the recent bitcoin price drop, Plan B still seems confident bitcoin’s price is “on track towards $100K.”
It started four months ago when Plan B tweeted about his “worst-case scenario for 2021” forecast in June. Plan B stated that he believed BTC prices would be “Aug>47K, Sep>43K, Oct>63K, Nov>98K, Dec>135K” in the worst-case scenario.
So far three out of four of his monthly price predictions have come to fruition and Plan B was also correct when he said: “$64K was not the top.” The miss this month was the first time Plan B’s prediction has been off so far as the call for November had a $98K target.
Plan B acknowledged that his prediction missed this month as bitcoin (BTC) prices slid under the $60K zone following the recent $69K ATH. “Floor model $98K [November] close will probably be a first miss (after nailing Aug, Sep, Oct). S2F model not affected and indeed on track towards $100K,” Plan B stressed to his 1.5 million followers on November 25.