Gold Bull Market – $6000 by 2019?
News
|
Posted 10/02/2017
|
9137
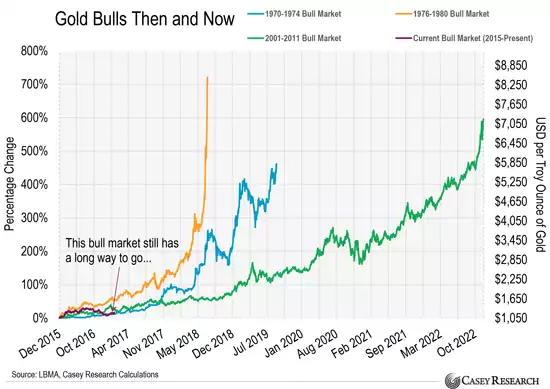
We’ve shown you the chart below (courtesy of Casey Research) before but it is worth updating and revisiting now. We could have a debate about whether, after the correction late last year, we are technically still in a bull market for gold or not, and you will have your own view. Casey Research certainly maintain we are, and remind us that every bull market has its corrections on the way. We often remind you that is why they are called ‘bull’ markets not ‘escalator’ markets… it can be a wild ride and there are always clowns in front of you testing your resolve.
Despite the correction last year (thanks in large part to Trump) we haven’t breached the lows set in December 2015, the market is intact. Trump will continue to influence the price of gold for some time, be that positively as his promises of fiscal stimulus look premature and trade/geopolitics moves look dangerous; or negatively like last night on a simple statement ‘promising’ "Something Phenomenal On Taxes In Next 2-3 Weeks".
The vertical axis on the left shows % gains in previous gold bull markets. The axis on the right shows the dollar value equivalent for the current market which started at $1050 in December 2015. As you can see, if we follow previous markets we could see gold at anywhere between $6000 and $8300/oz quite soon. Note the size of the corrections on the way, so any exit at what you think is the top at the time may be wise to be done in increments in case it is just an intra bull market correction.

Keep in mind too that the gold silver ratio is still up around 70:1. That is still very high. In each of those gold bull markets silver did what silver normally does as gold shoots up, silver rockets up, sling-shotting past as the GSR drops down to say 30 in 2011 or 18 in 1980. The latter would see silver at $333/oz if gold was $6000 or $461/oz if gold was $8300, a 2000% gain on today….
Again, history may not be an accurate indicator of future performance… but it often rhymes…