Silvers Global Supply Chain & Paper Promises
News
|
Posted 18/10/2021
|
7798
Silver investors are often unaware of where it comes from and where it goes. Today we share a great info graphic from Visual Capitalist on where it comes from but first for some context before you read those numbers lets look at what happened in the paper markets over the last week.
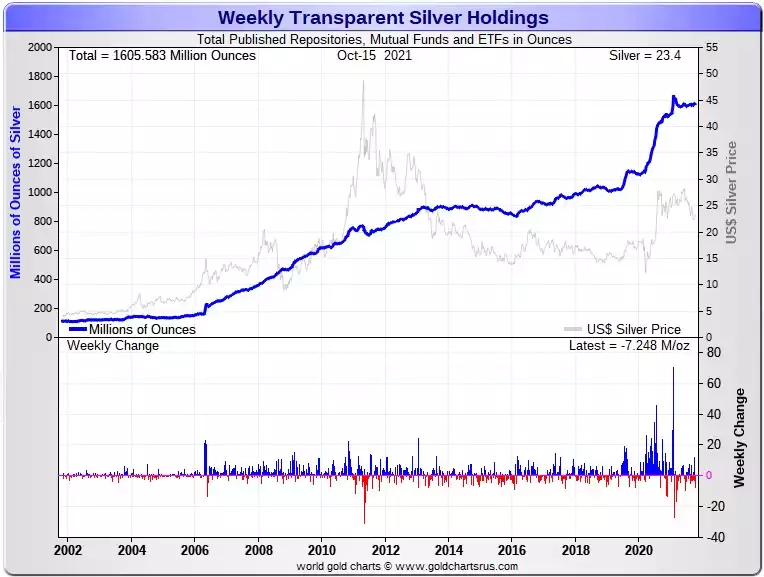
In the world’s largest ETF, SLV, late last week we saw an ‘authorised participant’ (one of the big guys who can actually put silver in and take it out as opposed to everyone else who can only put cash in and out) deposited a massive 7.4m oz (230 tonne) into SLV depositories. However in another unnamed ETF or mutual fund Deutsche Bank removed a whopping 8.4m oz. Someone clearly wanted/needed their physical…. And they weren’t alone, with the net of all holdings of silver across all published repositories, mutual funds and ETFs saw 7.2m oz removed.
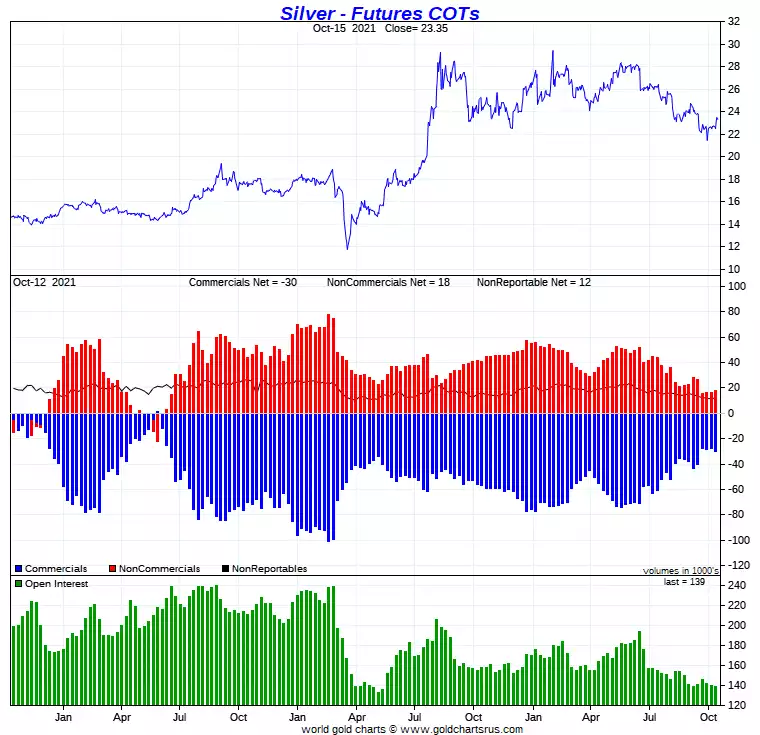
Drilling down into the COMEX futures, we saw the Commercials increase their short position by 12.6m oz. As you can see from the historic chart below, the moves of late, with the bottoming of that number in September is historically very constructive for the silver price.
So with those numbers in mind, now look at the supply of the real stuff below. Excusing the promotion of the Nevada based sponsor, the remainder is a salient reminder of the supply side constraints and risks for the real silver needed to back these paper promises. You can click on it to view in your browser to enlarge and there is further text discuss below the image.
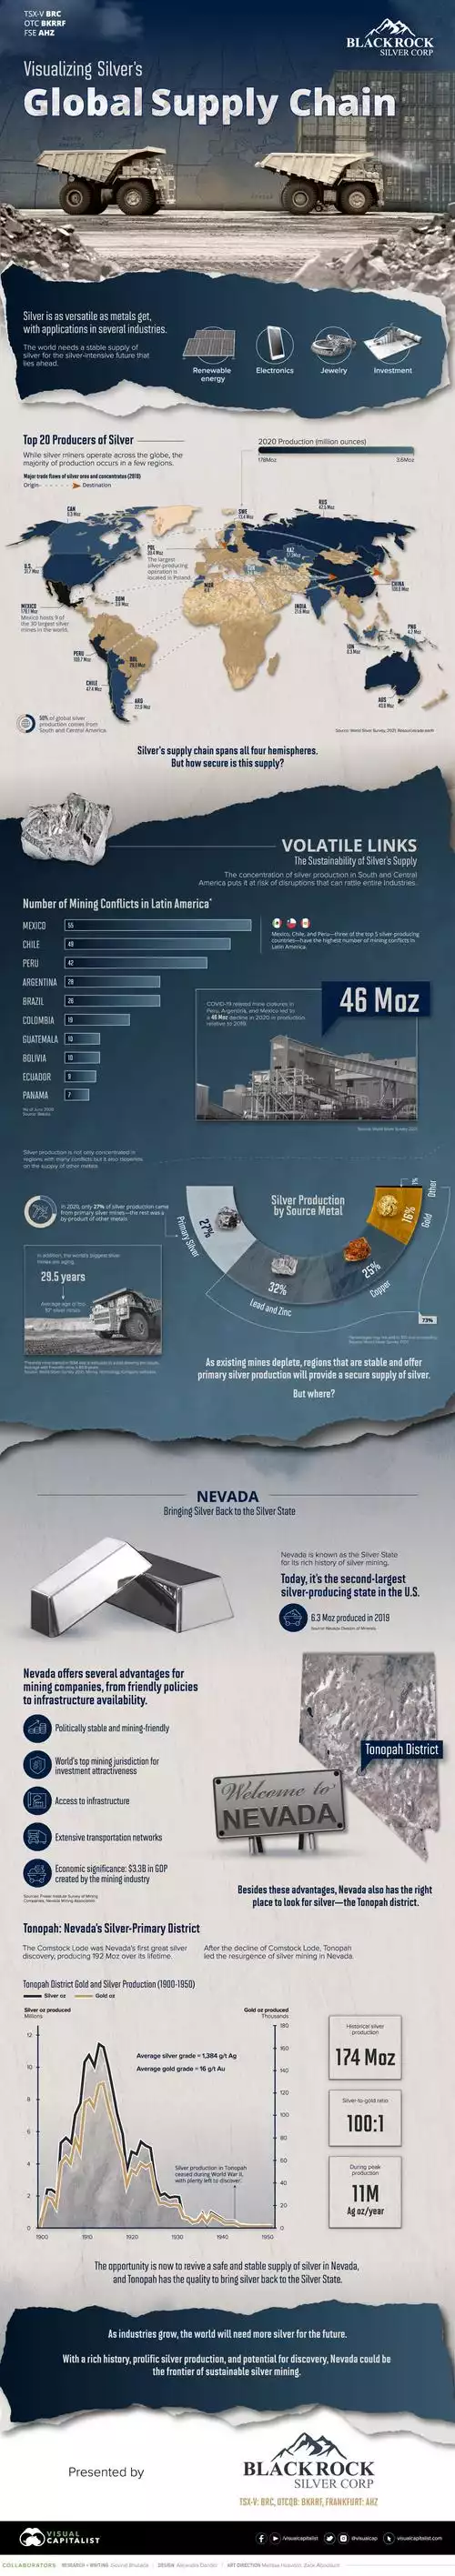
The Top 20 Countries for Silver Mining
Although silver miners operate in many countries across the globe, the majority of silver comes from a few regions.

Mexico, Peru, and China—the top three producers—combined for just over 50% of global silver production in 2020. South and Central American countries, including Mexico and Peru, produced around 390 million ounces—roughly half of the 784 million ounces mined globally.
Silver currency backed China’s entire economy at one point in history. Today, China is not only the third-largest silver producer but also the third-largest largest consumer of silver jewelry.
Poland is one of only three European countries in the mix. More than 99% of Poland’s silver comes from the KGHM Polska Miedz Mine, the world’s largest silver mining operation.
While silver’s supply chain spans all four hemispheres, concentrated production in a few countries puts it at risk of disruptions.
The Sustainability of Silver’s Supply Chain
The mining industry can often be subject to political crossfire in jurisdictions that aren’t safe or politically stable. Mexico, Chile, and Peru—three of the top five silver-producing nations—have the highest number of mining conflicts in Latin America.
Alongside production in politically unstable jurisdictions, the lack of silver-primary mines reinforces the need for a sustainable silver supply chain. According to the World Silver Survey, only 27% of silver comes from silver-primary mines. The other 73% is a by-product of mining for other metals like copper, zinc, gold, and others.
As the industrial demand for silver rises, primary sources of silver in stable jurisdictions will become more valuable—and Nevada is one such jurisdiction.