USD Fall & “The Structural Shift”
News
|
Posted 03/08/2020
|
8202
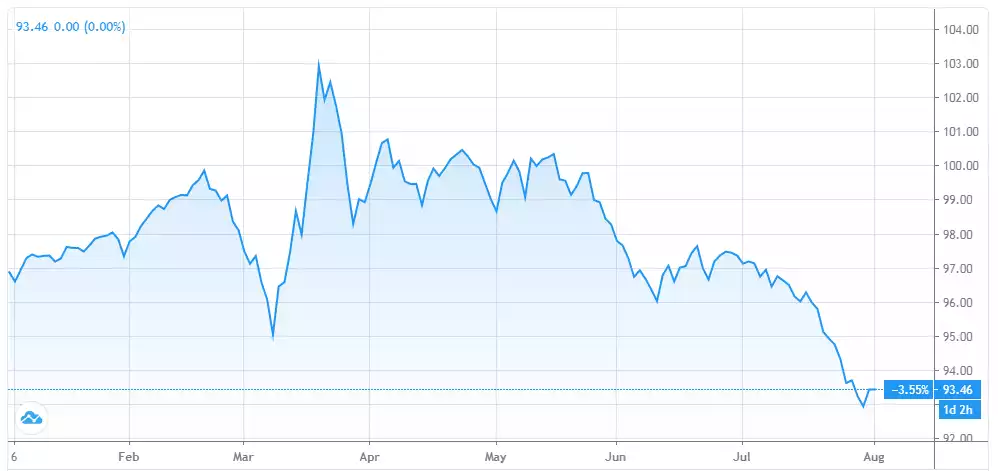
The USD had a positive close on Friday night after the DXY hitting 92.5. From its peak of 103 on 19 March (when gold and silver got smacked) the mighty US dollar has been on a steady decline whilst gold and more recently silver have rallied. At 93.5 now, it is also down 3.6% for the year.
The reason, yet again, is all around debasement. The Fed has printed just so much of the stuff, fears of debasement related inflation are building. The numbers around that stimulus are truly staggering. In the context of that record negative GDP print last week, Q2 saw $4.85 trillion in nominal GDP. In that same quarter, approximately $5 trillion of fiscal and monetary stimulus was injected into the economy. And so for the first time in history stimulus exceeded GDP of the biggest economy in the world…
Year to date it looks even worse, the Bank of America Merrill Lynch chief investment officer, Michael Hartnett, spelt out late last week that 2020 has seen a total of $20 trillion of stimulus unleased in the US, comprising $8.5 trillion in monetary stimulus from the Fed (as well as zero interest rates) and $11.4 trillion in deficit funded US government fiscal stimulus. That is just to date.
Hartnett talks to the unprecedented inflows into gold ETF’s, some $16.7 billion in just the last 6 weeks, but also the coinciding exit from cash after the huge rush into the USD in March. BofAML private clients currently have 58.7% in equities, 22.0% in debt (bonds), 13.0% cash and just 2.3% in gold and silver ETF’s even after the rotation from cash to gold. We wrote last week of the sheer size of those equities and bonds markets compared to gold and silver. Whilst 2.3% is up on what is normally less than 1% for gold’s share, it is a quarter of where it was in 2011 and 2012, last time gold reached all-time highs and when gold ETF’s represented 9.3% of BofAML’s private clients’ investments.

Just pause for a bit and consider that second chart in the context of gold already now being near those same highs seen in 2011 and 12. Those concerned they have somehow missed the boat on gold given its performance this year are more likely to be missing the point. Smart money is flowing into gold and silver now on just the warning signs of the effects of currency debasement. When the warning signs start to play out in real hard numbers we could then expect to see the masses pile in.
The updated BofAML total returns quilt shows gold firmly in #1 position for this year:

Interestingly Hartnett also looks at the macro environment and what these unprecedented stimulus measures debasing the US dollar may, and already in part, see play out in what he called a ‘structural shift’ encapsulated in 5 key points:
- the coming era of bigger government, smaller world,
- unconventional fiscal policy accelerated by pandemic, heralded by higher gold & weaker US dollar, best positioned for via commodities, HY bonds, and long RoW stocks vs US stocks;
- 2010s were decade of liquidity, globalization, profits;
- 2020s to be decade of deficits, localization, redistribution;
- War on Inequality means unconventional monetary policy of 2010s to be replaced by unconventional fiscal policies of 2020s…MMT [Modern Monetary Theory], UBI [Universal Basic Income], debt forgiveness [debt jubilee], unionization
The table below maps all this out in finer detail:

History is littered with such structural shifts. For newer readers who may have missed it, there are 2 must read articles on this topic back in May. Ray Dalio, head of the world’s largest hedge fund, spelt out the rise and fall of empires and the start and end of long term debt cycles.
Topically, Dalio is also record with the quote:
“If You Don't Own Gold, You Know Neither History Nor Economics”