Sentimental
News
|
Posted 17/09/2014
|
3340
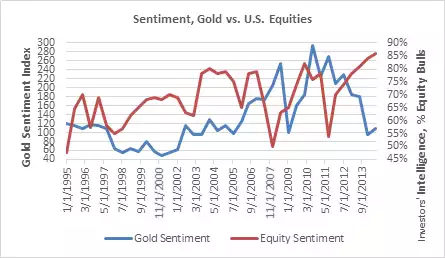
Further to yesterday’s contrarian investing article, we’ve come across another graph that sums it up beautifully. Have a look where sentiment of gold and silver was precisely at the beginning of the current secular bull market that started in 2001 when gold was around $250 and went to $1900 in 2011. Conversely have a look where sharemarket sentiment sits right now as they reach new highs.
If you haven’t read yesterday’s article please do. We are also sitting now at the 6 year anniversary of the Lehmans collapse that many pinpoint as the ‘date’ of the GFC. ZeroHedge posted a few telling graphs yesterday to commemorate this milestone and oh how telling they are. Interestingly, even after the corrections in silver and gold prices over the last 18 months, since the close before that fateful day silver is up 71%, gold up 61% and the S&P500 up 58%. Here in Australia our All Ords is still down about 20% on the pre GFC high as we haven’t had a central bank printing money hand over first propping it back up and unfortunately don’t have a great look forward with a post resources boom struggling economy.