Relief Hits The Crypto Market
News
|
Posted 26/07/2022
|
6492
After a month of consolidation, Bitcoin prices experienced a long-awaited relief rally, closing 9% above the weekly open. Price action opened at US$20,781, and rallied to a peak of $24,179 before pulling back towards the highs of the consolidation range over the weekend.
With the market valuation of Bitcoin falling over 75% in 2022, speculators have been largely expelled from the market. During this “expelling” process, we have witnessed an extreme redistribution of BTC from low conviction buyers (who entered the market at highs and capitulated first) to high conviction buyers (likely institutional buyers or multi-year HODLers).
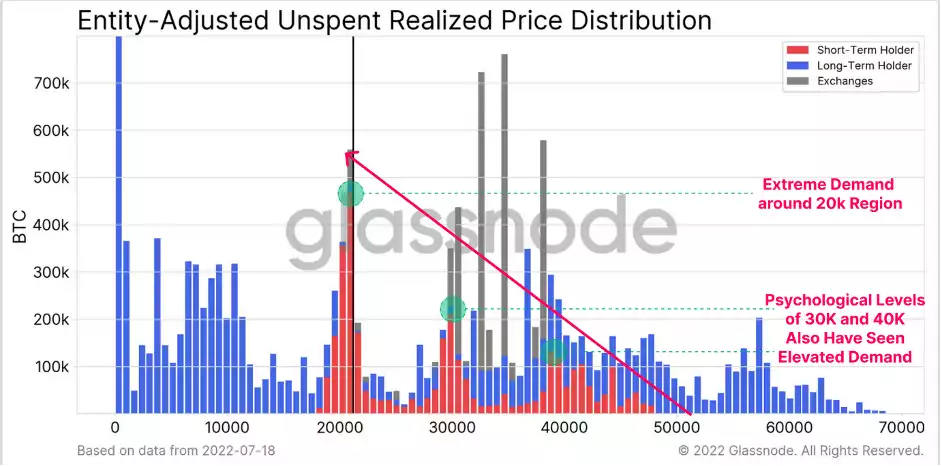
We can observe this phenomenon via the Unspent Realised Price Distribution (URPD), separated by the Short-Term and Long-Term Holder cohorts. Note, that the Short-to-Long-Term Holder threshold (155-days) is back in mid-Feb when prices were trading around $40k.
The $20K region has attracted a large cluster of Short-Term Holder coin volume. This is a result of a significant transfer of ownership from capitulating sellers, to new and more optimistic buyers.
Short Term Holder demand nodes can also be seen at the psychological price levels of $40K, $30K and $20K. Notably, much of this supply (incl. the LTH supply above) has not capitulated, despite prices trading more than 50% below their acquisition level. This is likely indicative of ownership by relatively price-insensitive buyers.
It would be constructive to see these STH-held coins at the $40k-$50K level start to mature to LTH status over the coming weeks, helping to bolster this argument.
As previously mentioned, prices have responded positively this week, breaking above the recent consolidation zone. This comes off the back of what may be considered a significant short-term over-correction, with many metrics reaching extreme statistical deviations.
This was driven heavily by a period of rapid deleveraging across the market, with many lenders, investors, and trading firms seeing collateral liquidated, either by discretion or as forced sellers – such as 3AC.
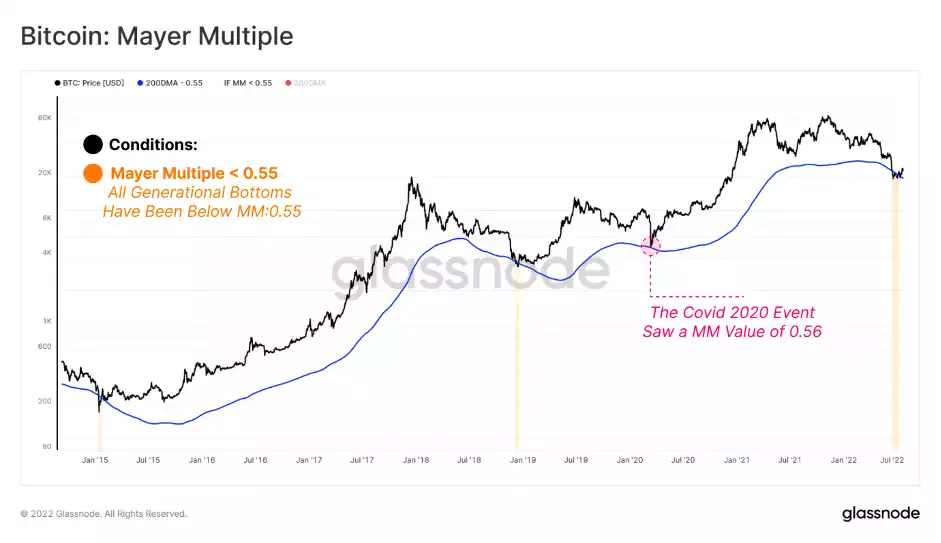
To gain a better idea of the capitulation that the market experience, we can look to The Mayer Multiple. The Mayer Multiple can be used to assess deviations between spot prices and the 200DMA. The 200DMA is widely used within traditional technical analysis as a tool to distinguish between macro bull and bear trends.
At the most extreme during this price correction, the Mayer Multiple had reached below 0.55, signalling the market was trading at a 45% discount to the 200DMA. Such events are extremely uncommon, and only account for 127 closes out 4186 days, a total of 3% of the trading history.
With so little price relief year to date, profitability has been poor for all investor classes. The Long Term Holder cohort is no exception, and their spending patterns suggest a non-trivial flush-out has occurred between May-June 2022.
However, long-term supply dynamics continue to improve, as redistribution takes place, gradually moving coins towards the HODLers. Notable supply concentrations are observable at $20K, $30K and $40K, which tend to align with both technical and on-chain price models, making these regions significant zones of interest.
Momentum in the short-term suggests a continuation of the upswing, provided the Realised Price and Long Term Holder Realised Price can hold as a support level. In the long-term, momentum suggests the worst of the capitulation could be over. Let’s see what the next week brings.